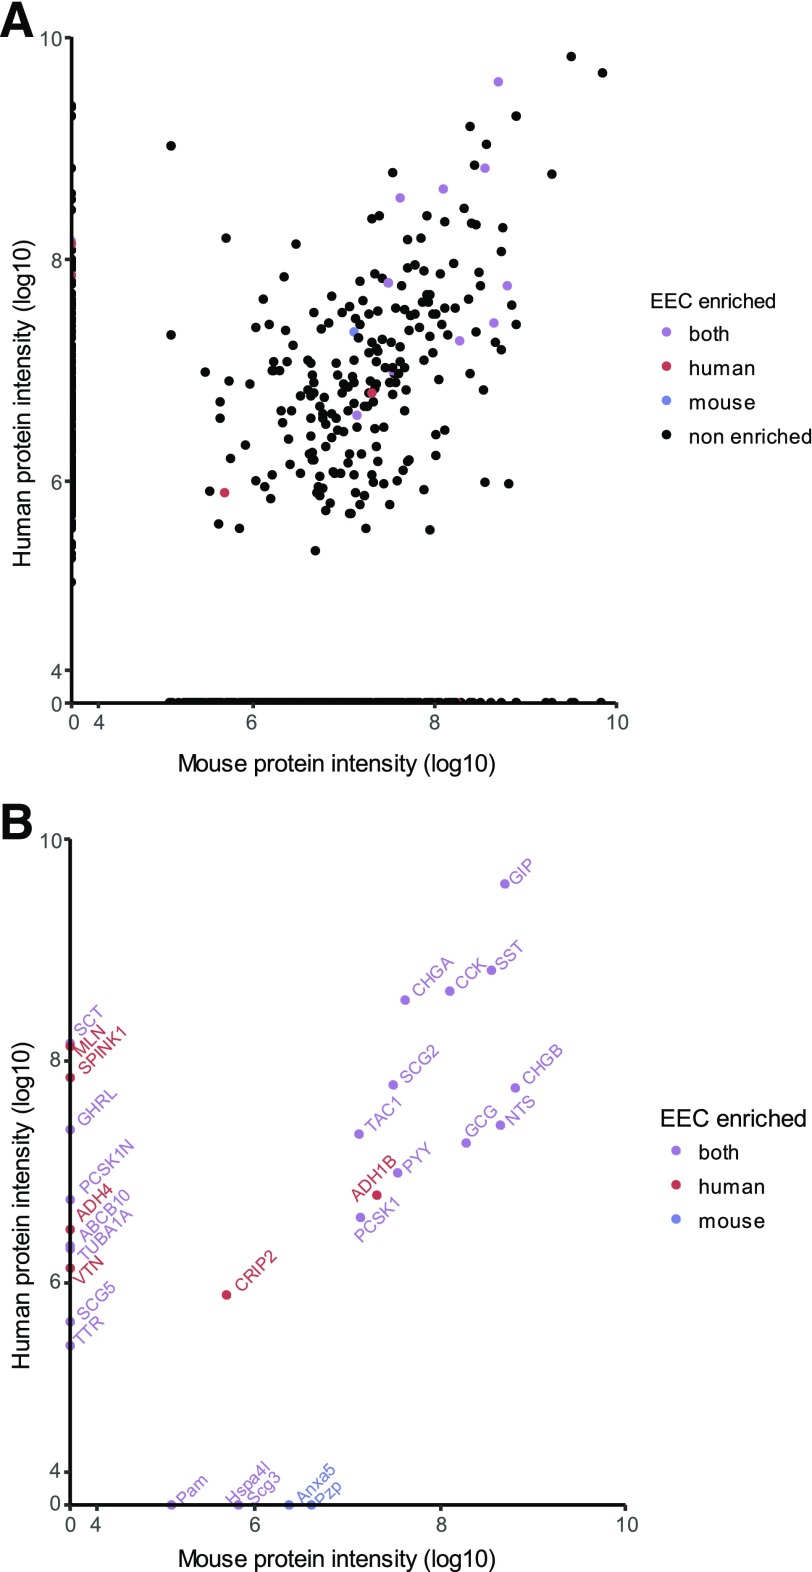
Figure 5.
Comparison between human and mouse jejunum peptidome. Tissue samples were analyzed by nano-LC-MS/MS and compared between human jejunum (n = 4) and mouse mid–small intestine (n = 4). Peptides were assigned to their parental proteins by Peaks software, and protein intensity was calculated by Peaks v8.0 for all proteins detected corresponding to genes with 1:1 homology between human and mouse for jejunum mucosal homogenates. A: All proteins. B: Proteins from genes enriched in at least one of the species from the human and the mouse transcriptome data sets. Enrichment was defined as adjusted P ≤ 0.1, fold difference >4, and base mean expression >50 from DESEQ2 model. Colors indicate in which species the mRNA for the genes was enriched.

