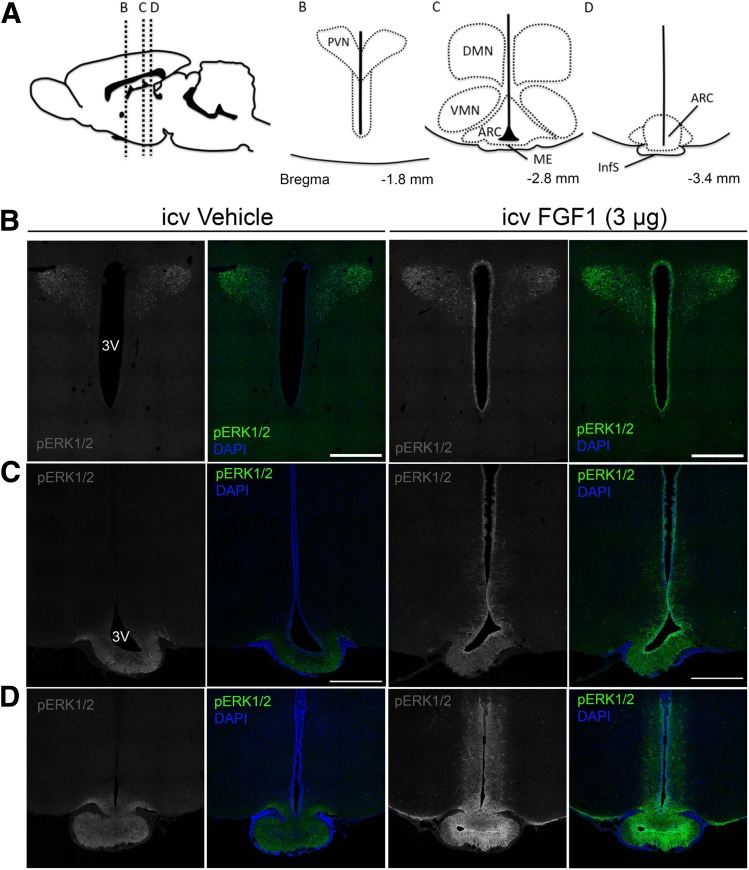
Figure 1.
Regional activation of MAPK/ERK1/2 signaling in the hypothalamus after icv FGF1. A: Diagram at top shows sagittal view of the rat brain (left) and inserts of the mediobasal hypothalamus (right) showing orientation of panel images of the PVN, ARC, ME, ventromedial nucleus (VMN), dorsomedial nucleus (DMN), and infundibular stalk (InfS). B–D: Confocal images of coronal sections showing pERK1/2 (green) and DAPI (blue) obtained 20 min after icv injection of either vehicle or FGF1 (3 μg). Images are taken from the PVN (B), the ARC-ME (C), and InfS (D). Scale bars: 500 μm (B and C). 3V, third ventricle.

