Figure 2.
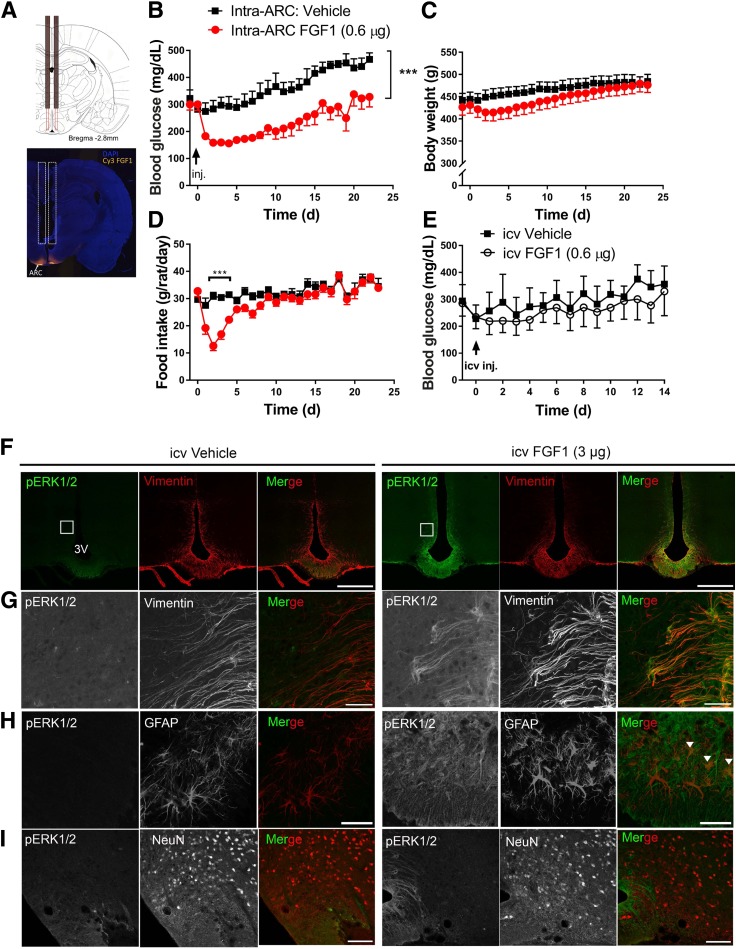
Effect of intra-ARC microinjection of FGF1 in ZDF rats. A: Scale diagram of bilateral intra-ARC guide cannula (top panel) and representative image of Cy3-labled FGF1 injectate spread following microinjection into the ARC area (bottom panel). Daily blood glucose (B), body weight (C), and food intake (D) from ZDF rats after a single bilateral intra-ARC microinjection of either vehicle (n = 7) (black squares) or FGF1 (0.3 μg/side, for a total of 0.6 μg; n = 8) (red circles). E: Daily blood glucose levels in ZDF rats after a single icv injection of either vehicle (n = 4) or FGF1 at a dose equal to that given by microinjection into the ARC (0.6 μg; n = 4). Significance determined by linear mixed-model analysis. Confocal images of coronal sections of the ARC-ME costained with antibodies to pERK1/2 (green) and markers of tanycytes (vimentin), astrocytes (GFAP), or neurons (NeuN) 20 min after icv injection of either vehicle (left panels, F–I) or FGF1 (3 μg) (right panels, F–I) in Wistar rats (n = 5/group). G: Higher magnification view of images shown in inset in F. Scale bars: 500 μm (F), 50 μm (G and H), 100 μm (I). Colocalization of GFAP and pERK1/2 denoted by white arrowheads in (H). Data are mean ± SEM. ***P < 0.001 vs. intra-ARC vehicle. 3V, third ventricle; d, days; inj., injection.

