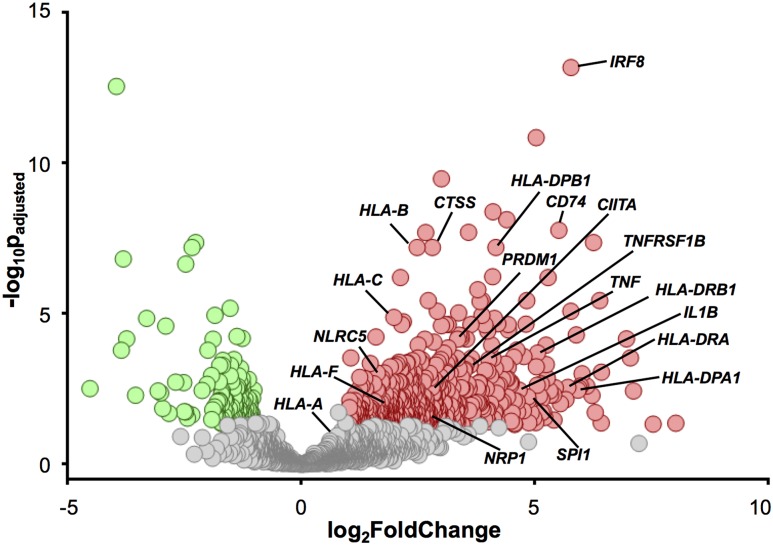
Figure 1.
Volcano plot shows differential gene expression from bulk β-cell populations and highlights the upregulation of immune response–specific genes in β-cells from donors with type 1 diabetes. β-cells were isolated using FACS based on insulin expression from donors without diabetes (N = 12) and with type 1 diabetes (N = 4). RNA was isolated and libraries were sequenced. The volcano plot shows the 650 genes that are differentially (P < 0.05 and fold change >2) upregulated (red circles, 504 genes) and downregulated (green circles, 146 genes) in the donors with type 1 diabetes. The lines point to individual circles and identify the −log10Padjusted and log2FoldChange for specific genes.

