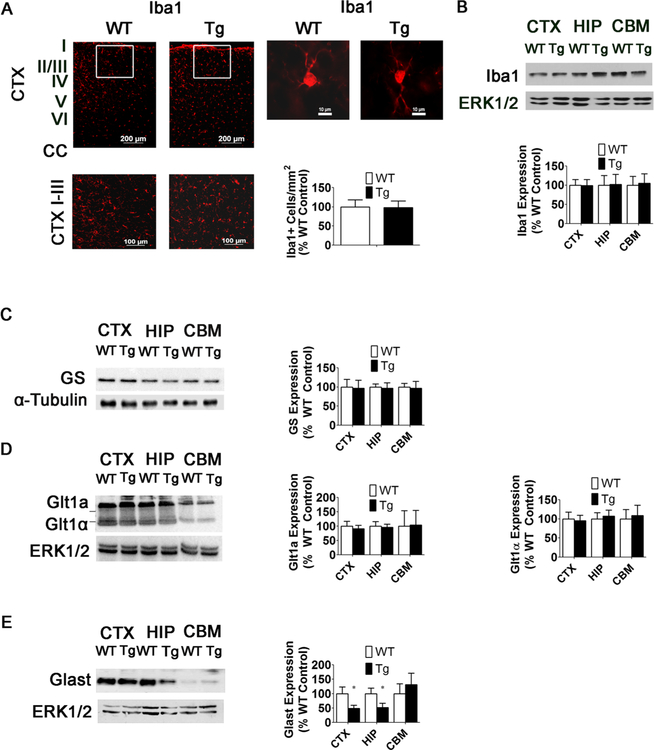
Fig. 8.
Increases in GFAP expression are not associated with a neuroinflammatory response. a Iba1 immunostaining and quantification in the CTX of 15-week-old WT and MeCP2-Tg mice (n = 5). Right panels, high-magnification image of single Iba1+ cell in 15-week-old WT and MeCP2-Tg mouse. b Western blot analysis of Iba1 expression and quantification in the CTX, HIP, and CBM of 15-week-old WT and MeCP2-Tg mice. Top panel is representative western blot and bottom panel is quantification of western blots (n = 3). c Western blot of glutamine synthetase (GS) expression and quantification of expression in the CTX, HIP, and CBM of 15-week-old WT and MeCP2-Tg mice. α-Tubulin was used as a loading control rather than total ERK1/2 because the molecular weight of GS overlaps with the molecular weight of total ERK1/2 (n = 3). d Western blot of Glt1 expression and quantification of Glt1 expression in the CTX, HIP, and CBM of 15-week-old WT and MeCP2-Tg mice (n = 3). e Western blot of Glast expression and quantification of Glast expression in the CTX, HIP, and CBM of 15-week-old WT and MeCP2-Tg mice (n = 3)

