FIGURE 2.

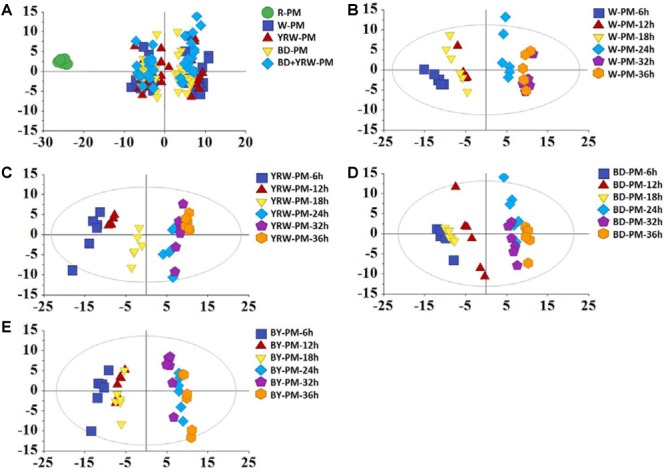
PC A scores plots of R-PM and four kinds of P-PM at different processing time for (A) all samples, (B) water-processed samples (W-PM), (C) yellow rice wine-processed samples (YRW-PM), (D) black soybean juice-processed samples (BD-PM), and (E) black soybean plus yellow rice wine-processed samples (BY-PM) at all time-points.
