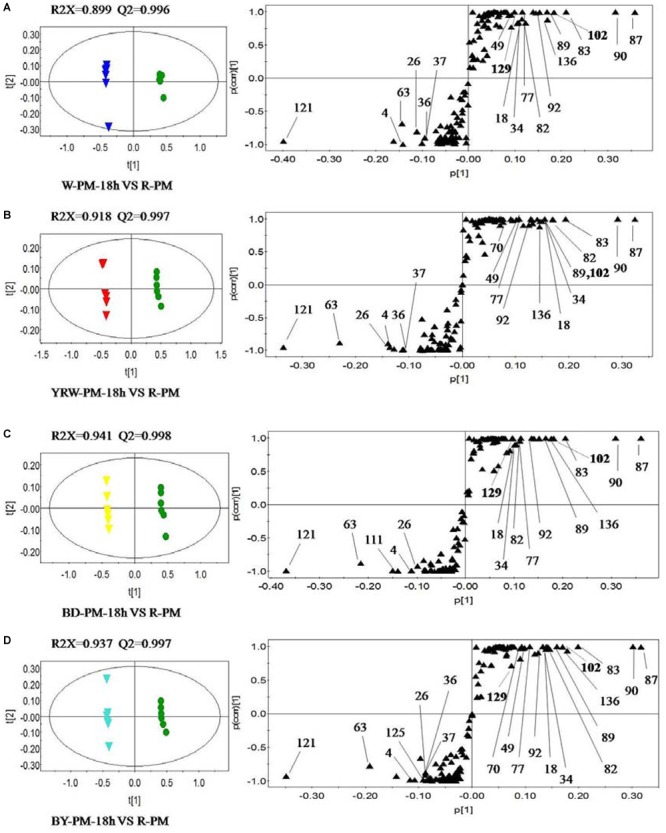
FIGURE 3.

OPLS-DA scores plots (left) and S-plots (right) showing the metabolic differences between four kinds of P-PM and R-PM for (A) water-PM ( vs. R-PM
  ), (B) YRM-PM (
 ) vs. R-PM (
 ), (C) BD-PM (
 ) vs. R-PM (
 ), and (D) BY-PM (
 ) vs. R-PM (
 ) at l8 h (The numbers of metabolites in S-plot were identical with those in Supplementary Table SI).
