FIGURE 6.

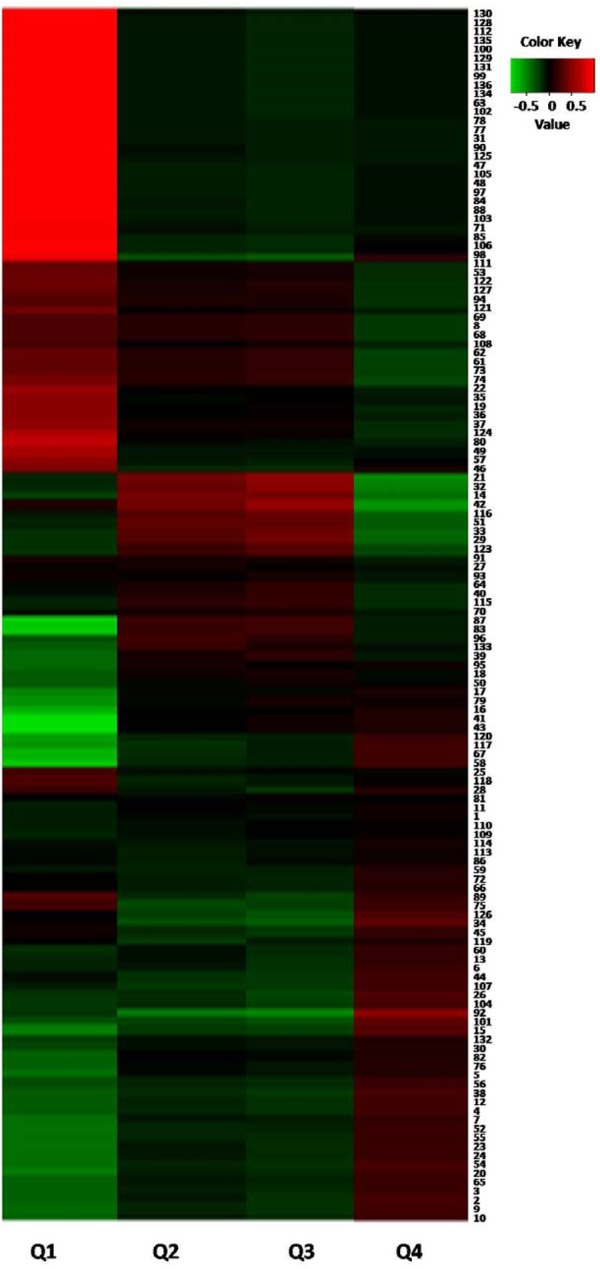
Correlation analysis between cytotoxicity and different metabolites from P-PM. (The numbers in the right part were identical with that of Supplementary Table SI).

Correlation analysis between cytotoxicity and different metabolites from P-PM. (The numbers in the right part were identical with that of Supplementary Table SI).