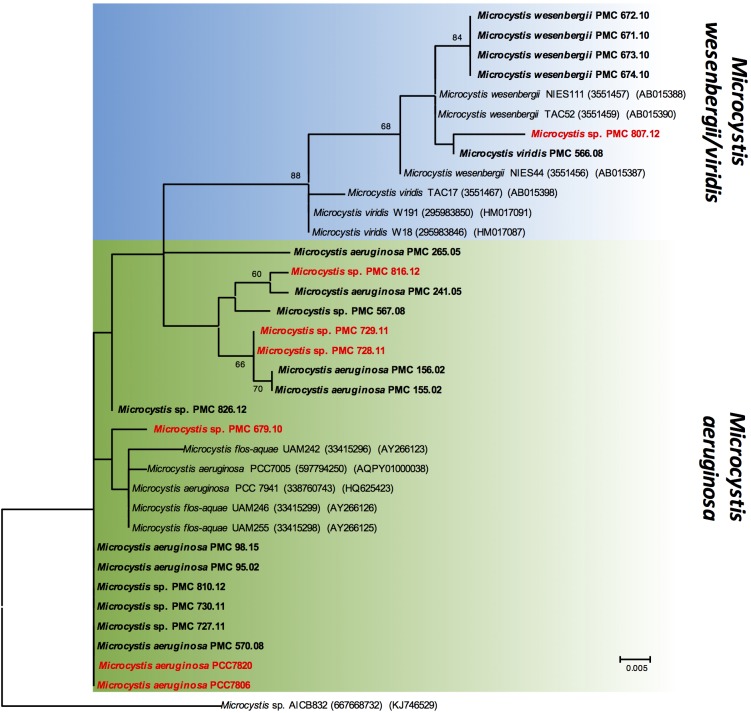
FIGURE 2.
Maximum likelihood (ML) tree based on partial 16S-23S ITS sequences. The sequences obtained in this study are indicated in bold. The strains, which exhibit mcyA gene, are indicated in red. Other sequences were retrieved from GenBank, accession numbers in brackets. Bootstrap values > 60% are shown at the nodes. The scale bar indicates number of nucleotide substitutions per site. The Microcystis sp. AICB832 was used as an out-group.

