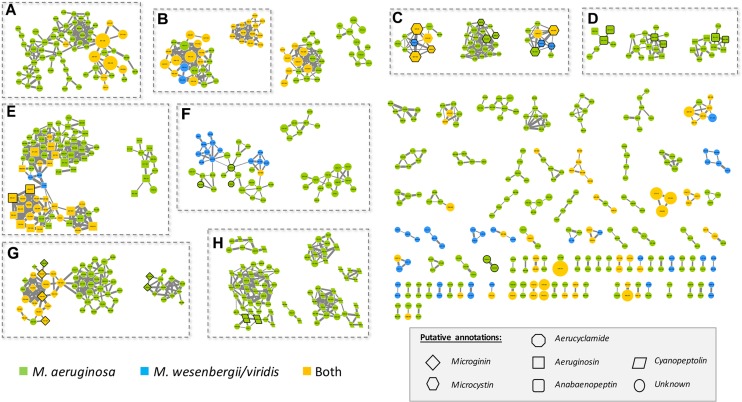
FIGURE 4.
Molecular network generated from MS/MS spectra from the 24 Microcystis strains using the GNPS tool (all data and results are freely available at the address http://gnps.ucsd.edu/ProteoSAFe/status.jsp?task=c017414365e84334b38ae75728715552). The nodes of the analytes detected in M. aeruginosa or M. wessenbergii/viridis strains only are indicated in green and blue, respectively, when analytes detected in both species are indicated in orange. Uncharacterized analytes are indicated by circles constituting potential new analogs. Analytes whom individual masses match with known secondary metabolites from cyanobacteria (listed in Supplementary Table S1) are indicated by specific shapes as shown on picture caption. Standard molecules analyses similarly, are indicated by heavy black lines. Only cluster regrouping at least 2 analytes are represented. A, di- or tri-peptide cluster; B, Unknown metabolite clusters; C, microcystin clusters; D, anabaenopeptin clusters; E, aeruginosin clusters; F, aerucyclamide clusters; G, microginin clusters; H, cyanopeptolin clusters. The clusters on the right are corresponding to un-annotated and smaller clusters.

