
Fig. 2.
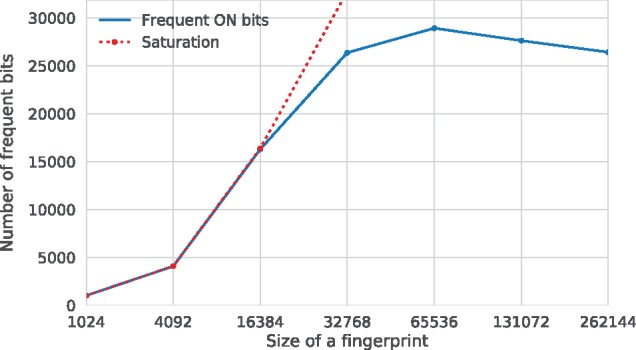
Fingerprint bits saturation plot. The depths of the PLEC FP are 5 and 1 for the protein and the ligand, respectively. For convenience, the fingerprint sizes are plotted on a logarithmic scale. The saturation line (dotted red) shows that all the bits are frequent. Unsaturated FPs are available for sizes larger than 16 384