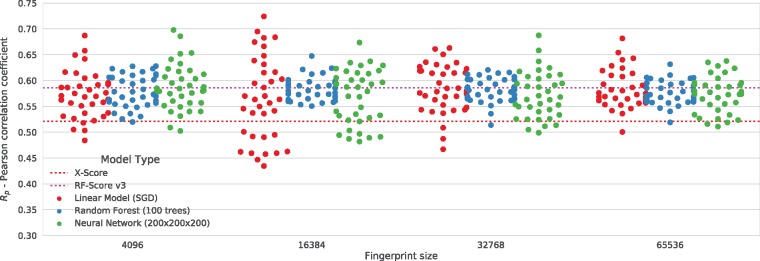
Fig. 5.
Prediction results from an independent test set. Correlation coefficients (Rp) for the Astex Diverse Set, depicted with coloured dots. Each dot depicts the result obtained for a particular combination of a model and fingerprint parameters: ligand depth (from 1 to 6), protein depth (from 1 to 6) and fingerprint size (212, 214, 215 and 216). Dots are coloured by the model used and separated on the X-axis by the fingerprint size. The red dotted line denotes the X-Score scoring function result, while magenta represents the RF-Score v3 result

