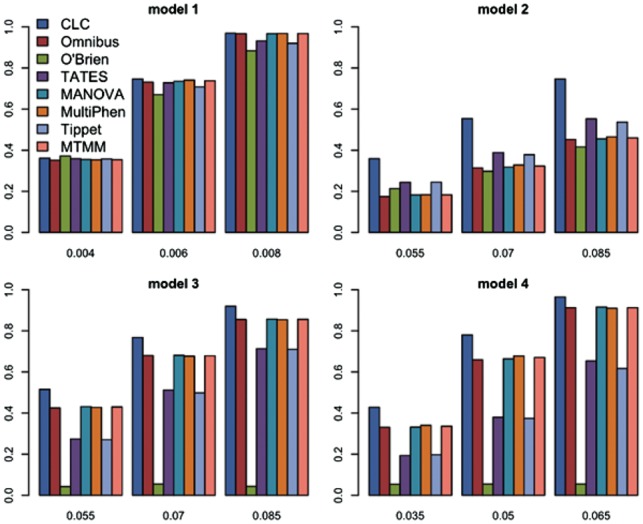
Fig. 1.

Power comparisons of the eight tests. The powers of O’Brien, Omnibus, CLC, TATES, MANOVA, MultiPhen, Tippet and MTMM as a function of effect size β for 20 quantitative phenotypes. The sample size is 1000. The between-factor correlation is 0.15 and the within-factor correlation is 0.25
