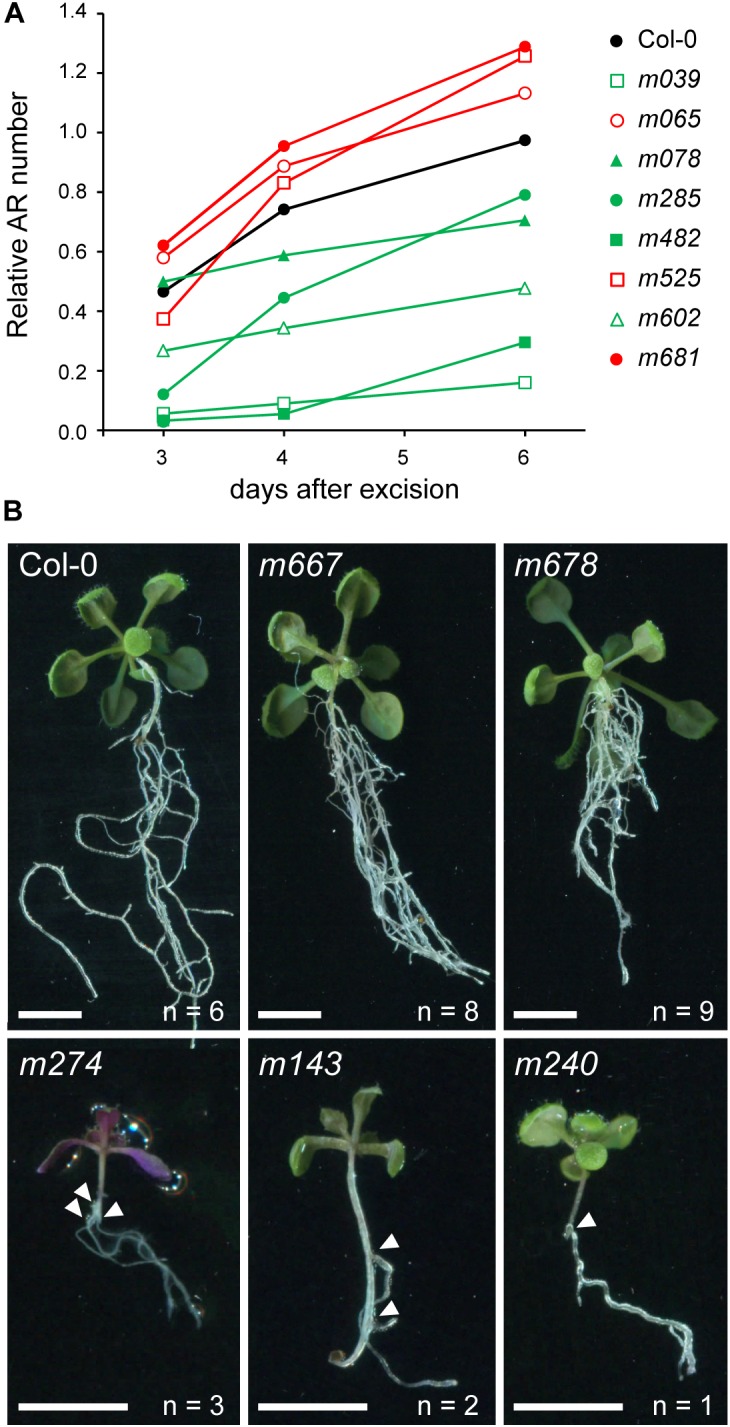
FIGURE 3.

Some AR formation mutants in the hypocotyl after whole root excision. (A) Temporal analysis of AR formation in a representative sample of the studied genotypes displaying highly significant differences (green, with lower AR values; red, with higher AR values; LSD, p-value < 0.05 at both 3 and 4 dae. See Supplementary Table S2) as regards their Col-0 background (shown in black). (B) Representative images of rooted hypocotyls of some mutants with altered AR formation. Arrowheads indicate the site of AR initiation. Numbers beneath images indicate ARs in each plant. Scale bars: 5 mm.
