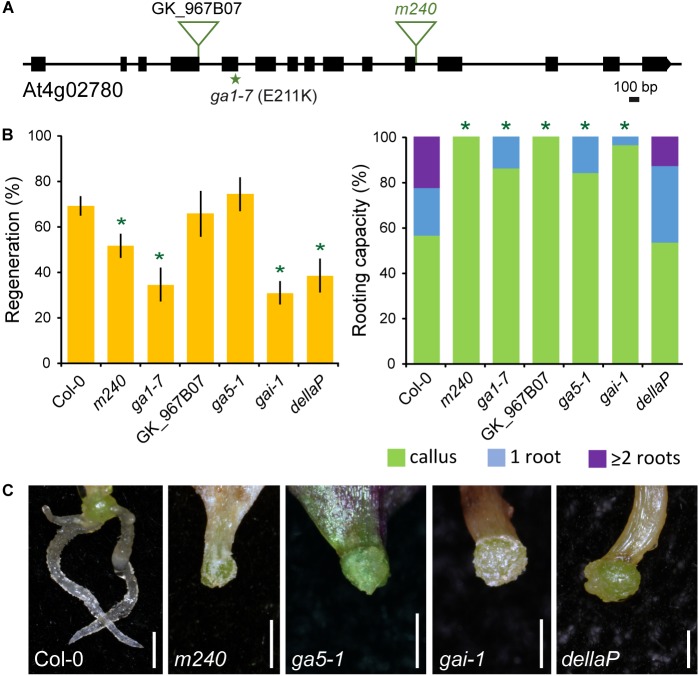
FIGURE 5.
Functional analysis of GA1 during AR formation. (A) Gene structure of At4g02780. Exons are represented by boxes and introns are depicted as lines. The studied mutant lines and annotated T-DNA insertion (triangles) lines are indicated. (B) Regeneration and rooting capacity in leaf explants of selected lines at 10 dae. Asterisks indicate significant differences (LSD; p-value < 0.01) with the Col-0 background; those with lower AR values are in green. (C) Representative images of whole leaf explants of the studied lines at 14 dae. Scale bars: 2 mm.

