FIGURE 6.
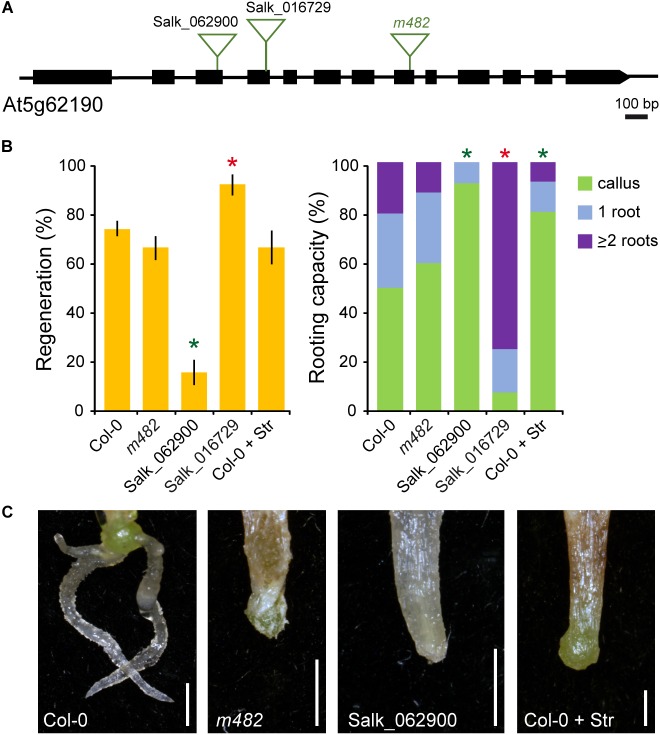
Functional analysis of AtRH7/PRH75 during AR formation. (A) Gene structure of At5g62190. Exons are represented by boxes and introns are depicted as lines. The studied mutant lines and annotated T-DNA insertion (triangles) lines are indicated. (B) Regeneration and rooting capacity in leaf explants of selected lines and treatments at 10 dae. Asterisks indicate significant differences (LSD; p-value < 0.01) with the Col-0 background; those with lower AR values are in green and those with higher AR values in red. (C) Representative images of whole leaf explants of the studied lines and treatments at 14 dae. Str: 30 μg ml-1 streptomycin. Scale bars: 2 mm.

