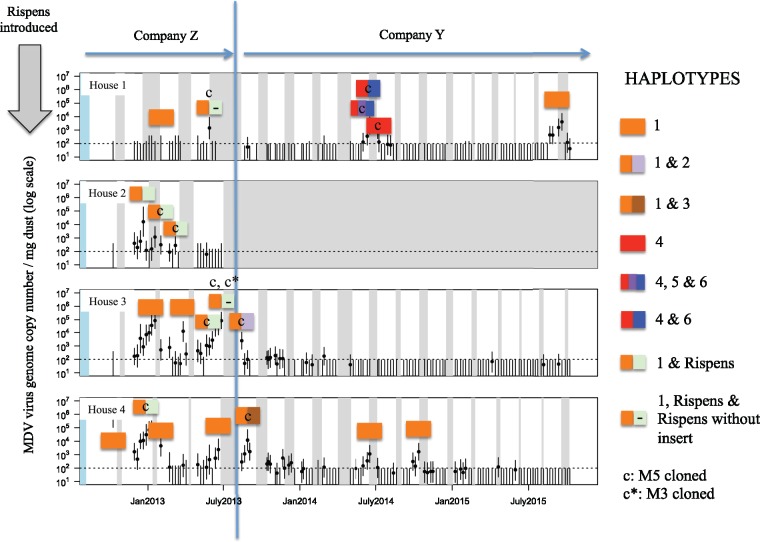
Figure 3.
Prevalence, intensity, and diversity of MDV haplotypes present on farm A between October 2012 and September 2015. The y-axis indicates MDV virus genome copies/mg dust as determined by qPCR (see Kennedy et al. 2017). Data points show the log-mean virus concentration from sampled dust and the vertical error bars show 95 per cent confidence intervals of the mean (explained in detail in Kennedy et al. 2017). White intervals represent when a flock of birds was present and gray intervals when birds were absent. The dotted horizontal line marks the approximate limit of confident detection by qPCR (100 virions/genomes per mg dust). The vertical arrow labeled ‘Rispens introduced’ denotes that one flock prior to the commencement of sampling, birds on the farm had been Rispens vaccinated. The vertical solid line indicates the time point at which this farm changed company affiliation. Individual colored bars represent individual dust samples and the different haplotypes present therein as described in Fig. 1. Split color bars for an individual dust sample indicate the presence of multiple variants present at that time. The colored bars are centered above the dust sample haplotyped. The pale green bar with a ‘–’ indicates the presence of two forms of Rispens vaccine: one with its characteristic meq gene that contains an insert not typically present in wild-type virus and a second form with a meq gene that does not contain this insert (see main text). ‘c’ denotes a sample that had M5 cloned; ‘c*’ a sample that had M3 cloned.

