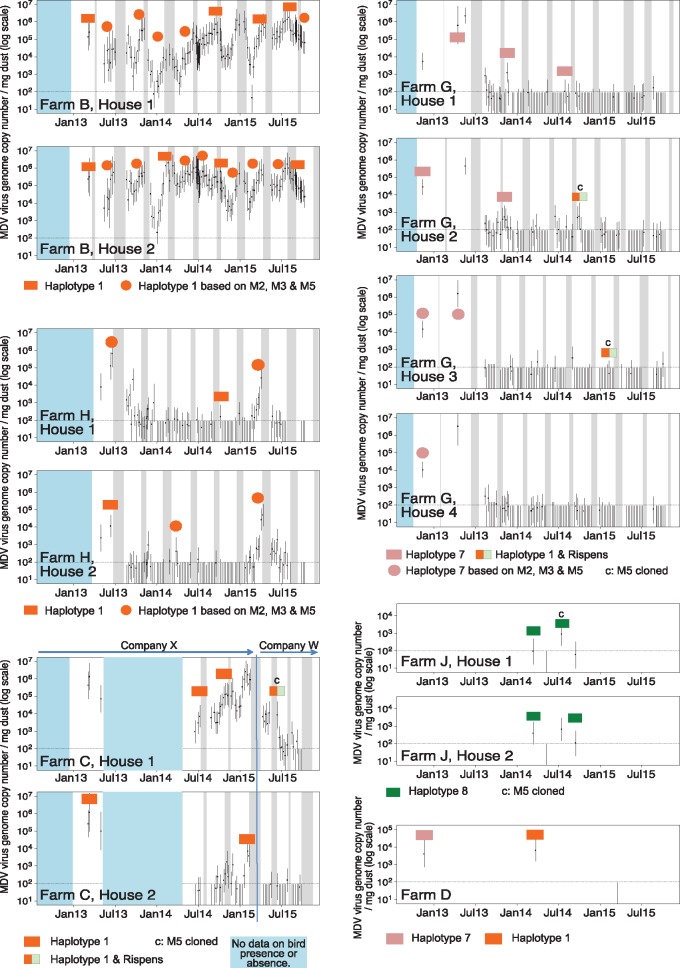
Figure 4.
Prevalence, intensity, and diversity of MDV haplotypes present on farms B, C, D, G, H, and J between March 2013 and September 2015. Graph layouts and axes are as described in Fig. 3. Individual colored bars represent different haplotypes as described in Fig. 1. Additional data points (colored circles) with haplotype identification based on only three markers (M2, M3, and M5) are also shown. The blue blocks indicate time periods when there was no data on the presence or absence of birds.

