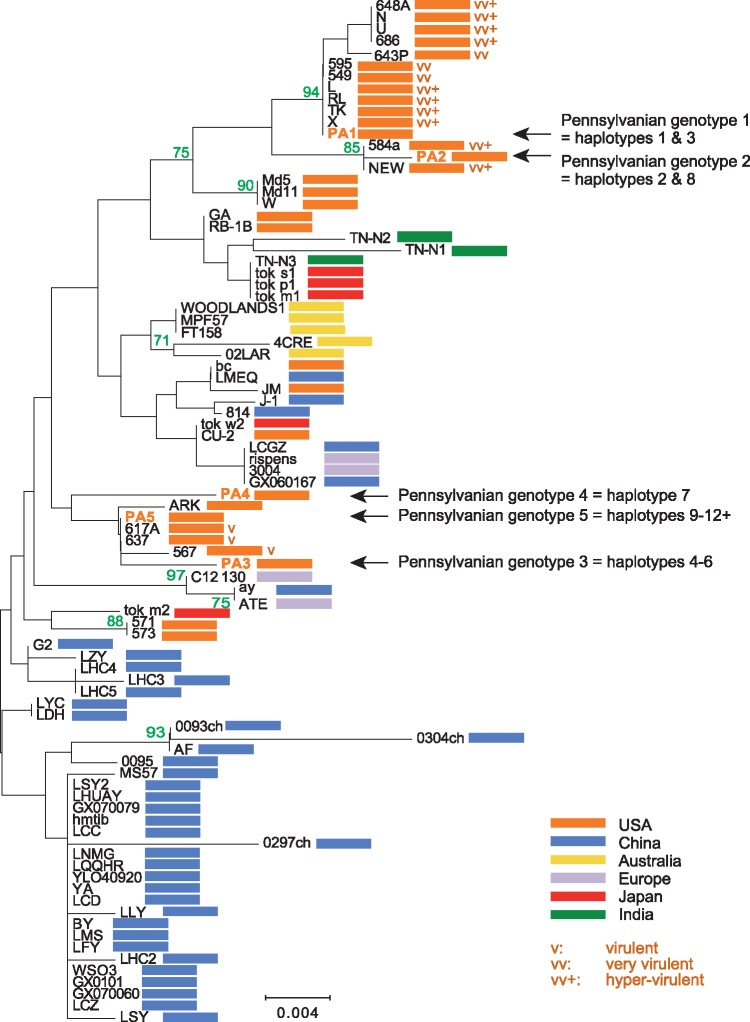
Figure 6.
Phylogenetic analysis of MDV based on Meq amino acid sequences. The optimal tree with the sum of branch length = 0.209 is shown. The tree is drawn to scale, with branch lengths in the same units as those of the evolutionary distances used to infer the phylogenetic tree. The analysis involved 88 complete Meq amino acid sequences. Accession numbers of individual isolate sequences are provided in the Supplementary Data. All positions containing gaps and missing data were eliminated. There were a total of 339 positions in the final dataset. Colored bars indicate country of origin. PA1 to PA5 show the five Pennsylvanian genotypes and their haplotype associations identified in the current study. Where known, pathotypes of isolates present in clades occupied by our Pennsylvanian haplotypes are indicated by ‘v’ = virulent, ‘vv’ = very virulent, and ‘vv+’ = hyper-virulent.

