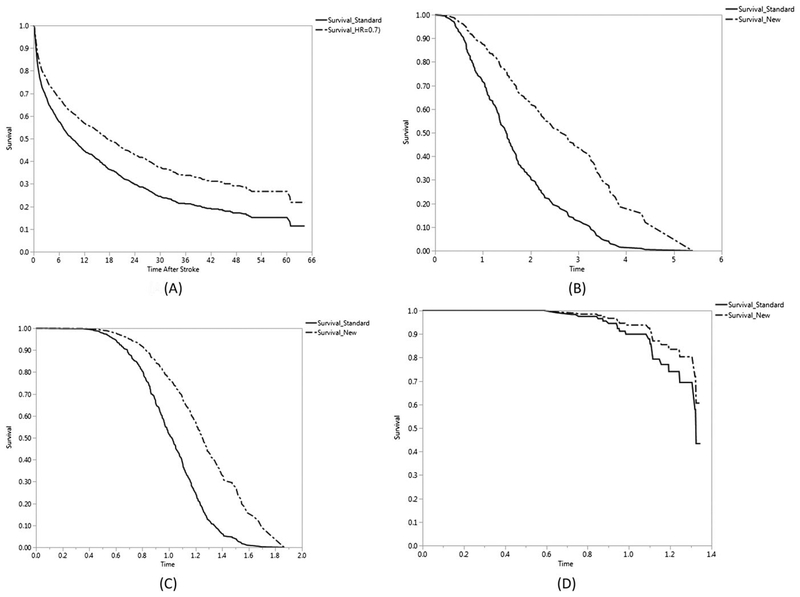
FIGURE 4.
Survival curves for comparing standard treatment arm to new treatment arm A, ischemic stroke observational study with ΔHR = 0.7, B, hypothetical data GG (μ = 0, λ = 0.832, σ = 0.416) with ΔHR = 0.4, C, hypothetical data GG (μ = 0, λ = 0.832, σ = 0.208) with ΔHR = 0.4, D, hypothetical data GG (μ = 0, λ = 0.832, σ = 0.166) with ΔHR = 0.6

