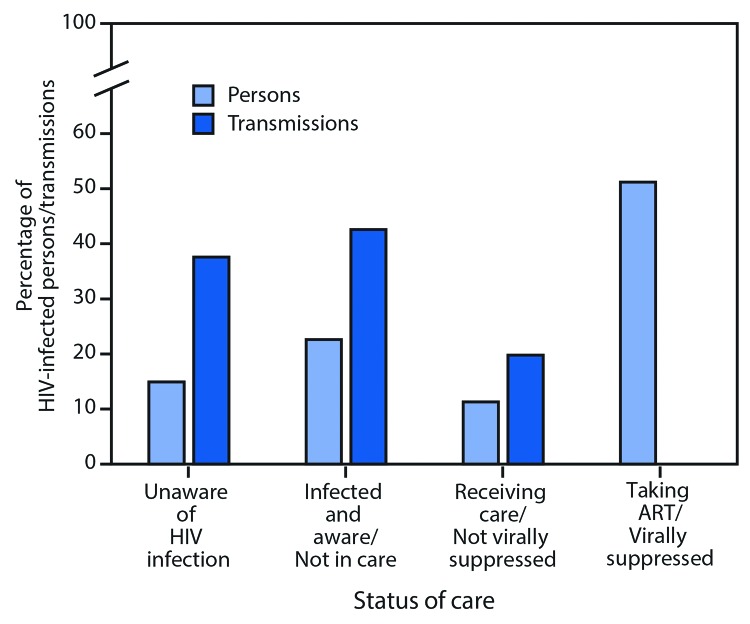
FIGURE 1.
Percentage of persons* with human immunodeficiency virus (HIV) infection and transmissions along the continuum of HIV care† — United States, 2016§,¶
Abbreviation: ART = antiretroviral therapy.
* Percentage of persons in each subgroup averaged over 12 months in the model.
† Receipt of medical care was defined as one or more tests (CD4 or viral load) in 2015.
§ Viral suppression was defined as <200 copies of HIV/mL of blood on the most recent viral load test.
¶ Unaware of HIV infection includes acutely infected and non-acutely infected persons unaware of their HIV infection.

