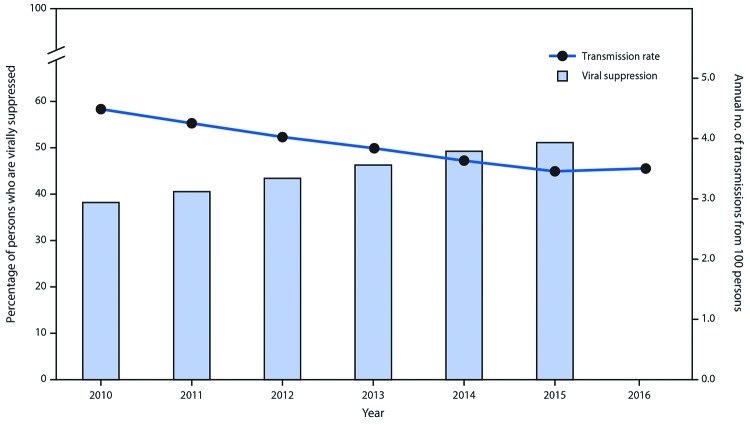
FIGURE 2.
Percentage of persons with human immunodeficiency virus infection (HIV) who are virally suppressed* and HIV transmission rate† — United States, 2010–2016§
* Viral suppression among persons with HIV infection; percentage obtained by multiplying the percentage with infection by the percentage virally suppressed among persons with diagnosed HIV. Viral suppression was defined as <200 copies of HIV/mL of blood on the most recent viral load test.
† Generated from model. Measured in number of transmissions per 100 person-years (i.e., annual number of transmissions from 100 persons).
§ 2016 viral suppression data is not yet available.

