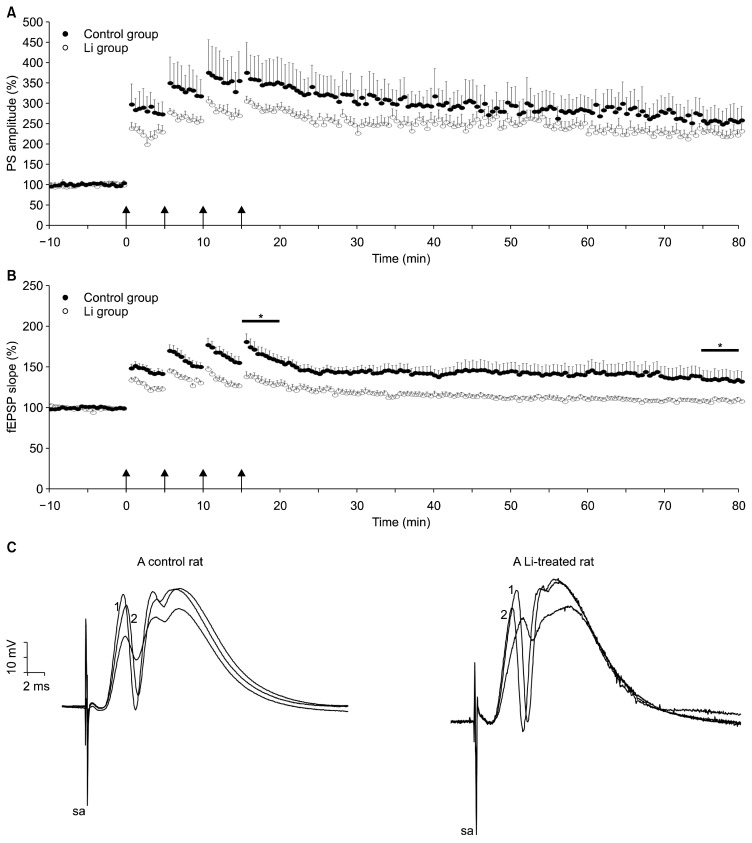
Fig. 4.
Time course of popultion spike (PS)-long-term potentiation (LTP) (A) and excitatory postsynaptic potential (EPSP)-LTP (B) in the dentate gyrus from the control group (filled) and the lithium group (empty circle, a 40-day treatment). After a 10-minute baseline recording, LTP was induced by means of high-frequency stimulation (arrows; 100 Hz, 1 second, 4 times), which was applied beginning at time 0 (arrows). This protocol induced LTP of both PS (A) and field EPSP (fEPSP) (B) in the dentate gyrus neurons of both group. The fEPSP slope was less potentiated between 15–20 minutes (short-term potentiation) and between 75–80 minutes (LTP) in lithium-infused (Li) group compared to saline-infused group (*). (C) Traces are representative of field potential recordings made immediately before (time point, −1 minute; not depicted) and after high-frequency stimulation (time point, 15 minutes; depicted with “1”) and at the end of the experiment (time point, 75 minutes; depicted with “2”). Note the higher ratio of fEPSP slope in trace depicted with “2” to that in trace not depicted (the magnitude of LTP) in a control rat.
sa, stimulus artifact.

