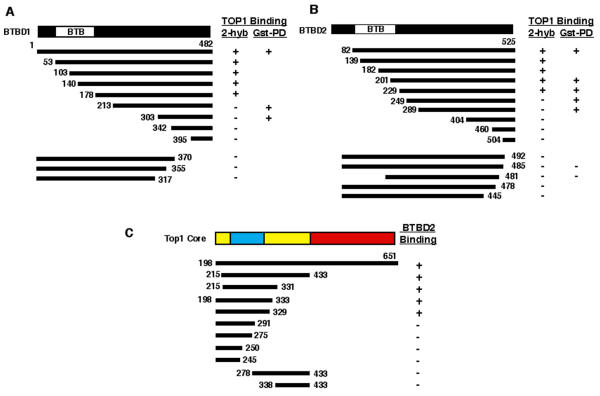
Figure 3.
Deletion mapping of the interacting regions of TOP1 and BTBD1 and BTBD2 using two-hybrid assays.A. Deletions of BTBD1 and their interaction with cTOP 1 (residues 198–651). B. Deletions of BTBD2 and their interaction with cTOP1. C. Deletions of cTOP1 and their interaction with BTBD2. Interactions were tested using colony formation assays on plates lacking histidine or uridine and the β-galactosidase colony color assay. The TOP1 core domain regions are shown from N- to C-terminus: subdomain I (yellow), subdomain II (blue), subdomain I (yellow) and subdomain III (red). The shortest clones obtained from two-hybrid screening were downstream of the BTB domains, beginng at residue 186 and 219 for BTBD1 and BTBD2, respectively. Results are summarized for the two-hybrid (2-hyb) and the GST-pull down assays (Gst-PD, see Fig. 4)

