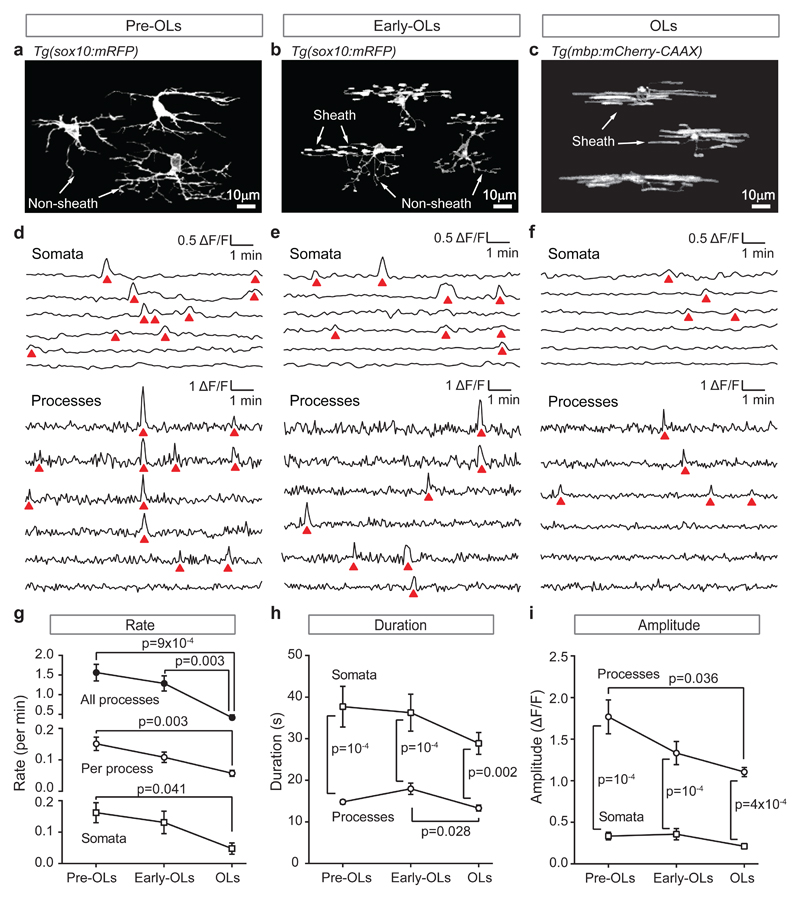
Figure 1. Calcium transient properties change during oligodendrocyte development.
(a-c) Oligodendrocyte morphology at different developmental stages (3 cells from different CRISPR/Cas9-injected tg(sox10:mRFP) fish for each stage): (a) pre-OLs, before sheaths have been initiated; (b) early-OLs, when some sheaths have been initiated; (c) OLs, when all sheaths have been initiated. (d-f) Specimen [Ca2+]i traces for 3 developmental stages showing: (top) sequentially-recorded traces for the somata of 6 cells, and (bottom) simultaneously-recorded traces in different processes of a single cell of each class. A [Ca2+]i rise (red triangle) occurs simultaneously in 4 processes in d. (g-i) Rate, duration and amplitude of the transients at the 3 developmental stages (n=10 pre-OLs, 8 early-OLs and 8 OLs from 5, 6 and 6 animals respectively). P values are from 2-tailed tests: one-way ANOVA followed by Holm-Bonferroni-corrected t-tests in g for ‘all processes’, and h and i for ‘processes’; Kruskal-Wallis followed by Dunn’s test in g for ‘per process’ and ‘somata’, and in h and i for ‘somata’; two-way ANOVA followed by Holm-Sidak in h and i for ‘somata’ vs. ‘processes’. Data are mean±SEM.

