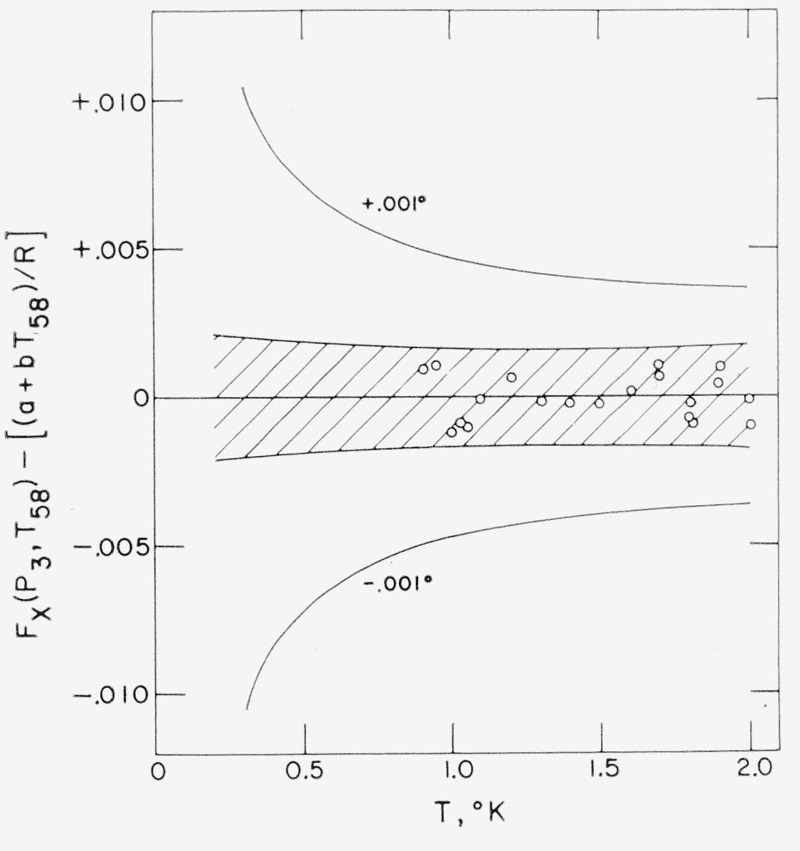
Figure 1.— Deviations from the ETE Scale, eq (1).
The circles are deviations from the fitted equation of the function Fx(P3, T58) calculated from eq (2) for each input (P3, T58) data point. The central cross-hatched area is the 95 percent prediction interval [53] for a prediction of Fx(P3, T) from eq (1) as calculated from the ± values for a and b given in eqs (3) and (4). The outermost solid curves represent a change in Fx(P3, T) corresponding to a 1 mdeg change in temperature and are calculated as 0.001 T(dln P3/dT)sat.

