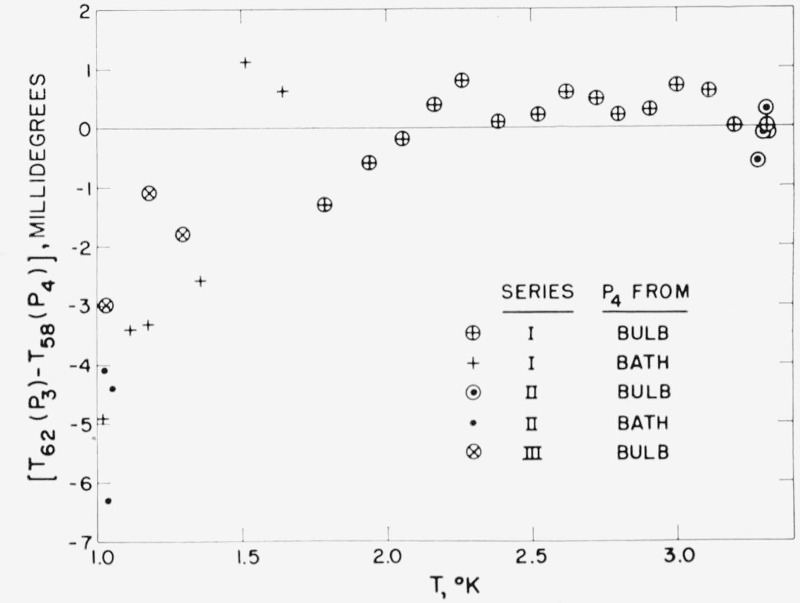
Figure 2.— The deviation in millidegrees of the 1950 Abraham, Osborne, and Weinstock [5] (P3, P4) data from the 1962 He3 Scale: T62(P3) − T58(P4).
The uncircled crosses and small dots are data points below the λ-point for which the He4 cryostat bath pressure was published as P4. For the encircled points a He4 vapor pressure bulb was fastened to the He3 bulb.

