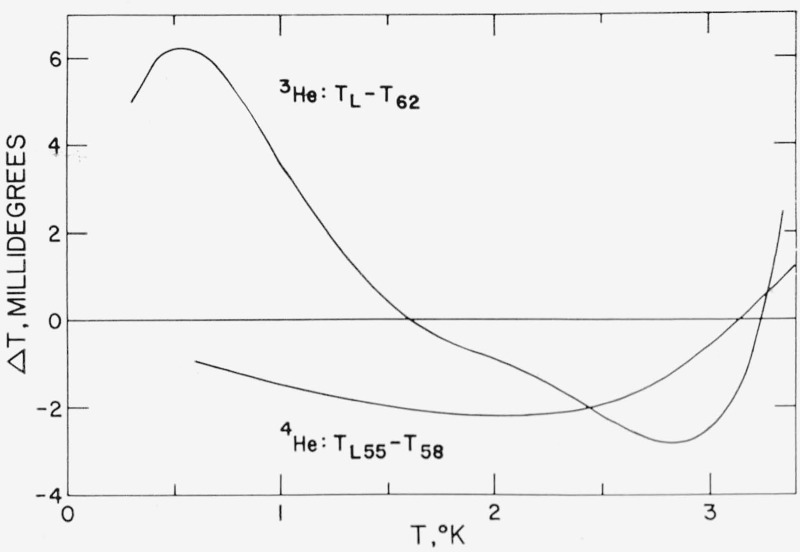
Figure 5.— Graphs of differences between old and new He3 and He4 temperature scales.
The He3 curve, TL(P3)—T62(P3), is a graph of the difference between the TL Scale [9] and the 1962 He3 Scale. The He4 curve is the difference between the TL55 Scale [25] and the 1958 He4 Scale given in table 6 of ref [2], It was intended in their derivations that the TL Scale would reproduce the TL55 Scale, and that the 1962 He3 Scale would reproduce the 1958 He4 Scale. The difference between the two curves is explained principally by the new (P3,P4) intercomparison data of Sydoriak and Sherman [46] used in deriving the 1962 He3 Scale.

