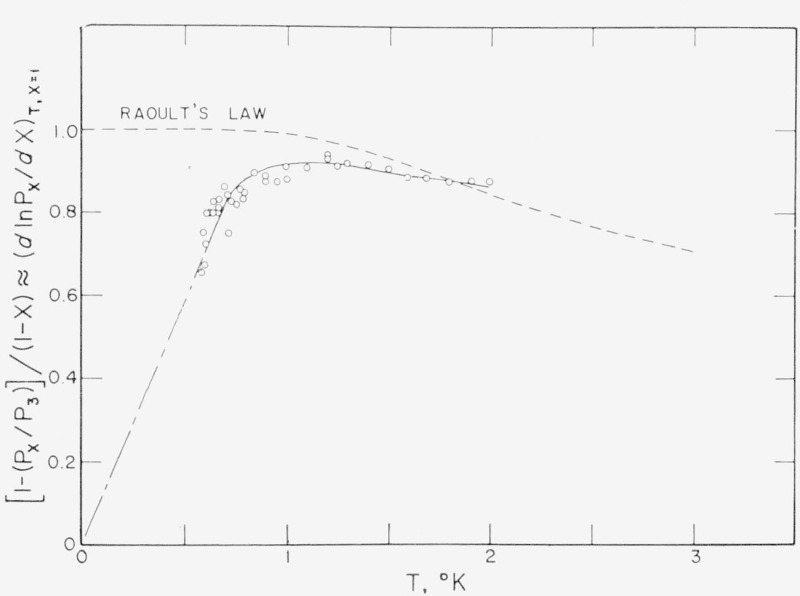
Figure 6.— The correction factor for He4 impurity.
The circles are the data points of Sydoriak and Roberts [32] for He3 mole fraction, X, of 0.897. The solid curve from 0.6 to 2.0 °K is drawn through the smoothed table values of ref. [32] for X=0.9. The long and short dashed curve is an arbitrary extrapolation to 0 ° K. The dashed curve is Raoult’s Law, eq (15).

