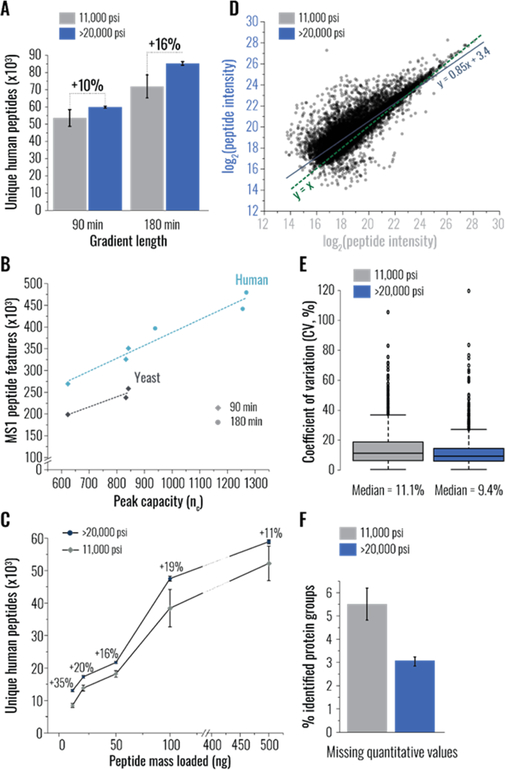
Figure 2.
Benefits of ultra-high pressure (uHP) column packing for diverse shotgun proteomics analyses. In all panels, data in gray and blue correspond to experiments conducted using columns packed at low (11,000 psi) and ultra-high (>20,000 psi) pressure, respectively; “>20,000 psi” and “11,000 psi” groups consist of six and three column replicates, respectively, each an average of two injection replicates. In panels A, C, and F, error bars represent standard error of the mean. (A) Unique human peptides identified in 90 and 180 min LC-MS/MS analyses of the whole proteome tryptic digest of K562 cells using capillary columns packed at the specified maximum pressure. (B) The effect of peak capacity (nc) on the total number of peptide-like features3 observed in MS1 (survey) scans of analyses performed using columns packed at the indicated maximum pressure. Results combined from 90 and 180 min analyses of human peptide mixtures are shown in light blue, and 90 min analyses of yeast samples are in dark gray. (C) Unique human peptides identified in indicated amounts of the whole proteome tryptic digest of K562 cells using columns packed at the specified maximum pressure. Percent increase achieved using uHP packed columns is indicated above each data point. (D) Scatter plot comparing log2-tranformed intensities of identical peptide precursors detected in analyses of 10 ng peptide injections using columns packed at different pressure. The line of best fit for the data set is shown in dark blue, and the y = x line is in dark green. (E) Box plots comparing coefficient of variation (CV, %) of label-free quantification (MaxQuant) observed in analyses of 10 ng peptide injections using columns packed at the specified maximum pressure. Data set medians are indicated below the boxes. (F) Missing label-free quantitative values (protein groups lacking MaxLFQ abundance measurements), reported as a percent of all identified protein groups, quantified in analyses of 10 ng peptide injections using columns packed at the specified pressures.

