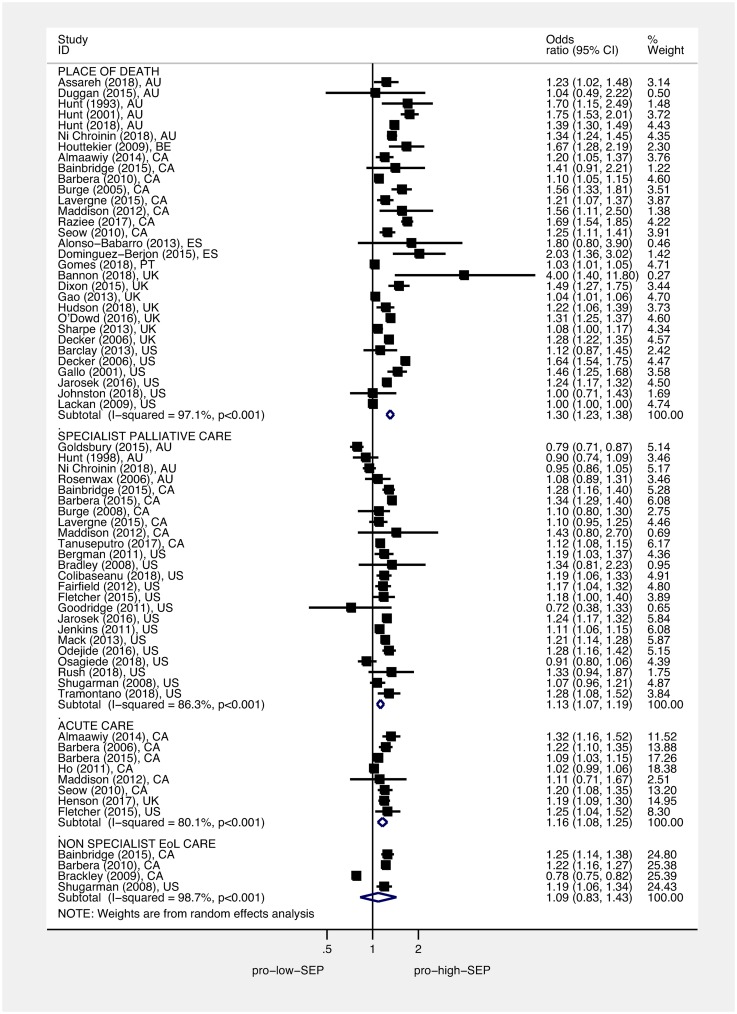
Fig 4. Association between area deprivation and: Place of death, use of acute care, and use of specialist palliative care.
Squares show ORs for the most area deprived compared to the least area deprived; diamonds show pooled effects using random-effects models. Place of death (death in hospital versus death at home/hospice/LTC), use of acute care (use of acute services last 3 months of life versus no use), and use of specialist palliative care (not accessing specialist palliative care in the last year of life versus accessing). ORs have been standardised so that >1 indicates that those living in the most deprived areas have higher odds of a worse outcome than those living in the least deprived areas. EoL, end of life; LTC, long-term care; OR, odds ratio; SEP, socioeconomic position.

