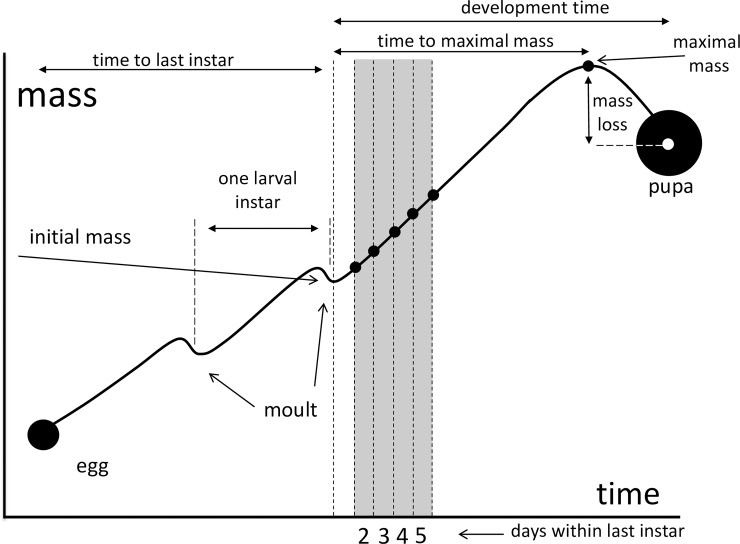
Fig 1. Growth trajectory of an insect larva, with an indication of descriptive statistics recorded in the present study.
The grey bars represent the days in the beginning of the last instar, for which the measures of differential of growth rate were calculated. The presentation on the growth trajectory is schematic and bears no quantitative correspondence with that of Ematurga atomaria which has 5 larval instars.

