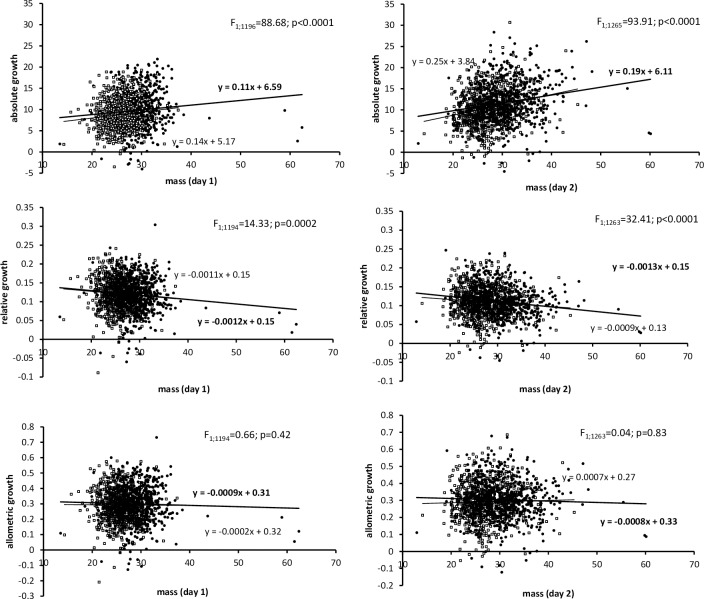
Fig 2. Size-dependence (results of mixed ANOVAs with sex and food plant as fixed factors and brood as a random factor) of three different measures of differential growth rates (absolute–mg·day-1; relative–day-1; allometric–mg1/3·day-1; see text) in female (solid circles) and male (empty squares) Ematurga atomaria larvae.
Vertical axes represent growth rates calculated for the 2nd (left panels) and 3rd (right panels) days of larval growth in the final larval instar and horizontal axes represent masses (mg) recorded one day before the growth rate measurements. This way we avoided the situation that the two variables being correlated contain common elements, a situation known to cause statistical artefacts [49]. Regression lines and equations in bold represent females.

