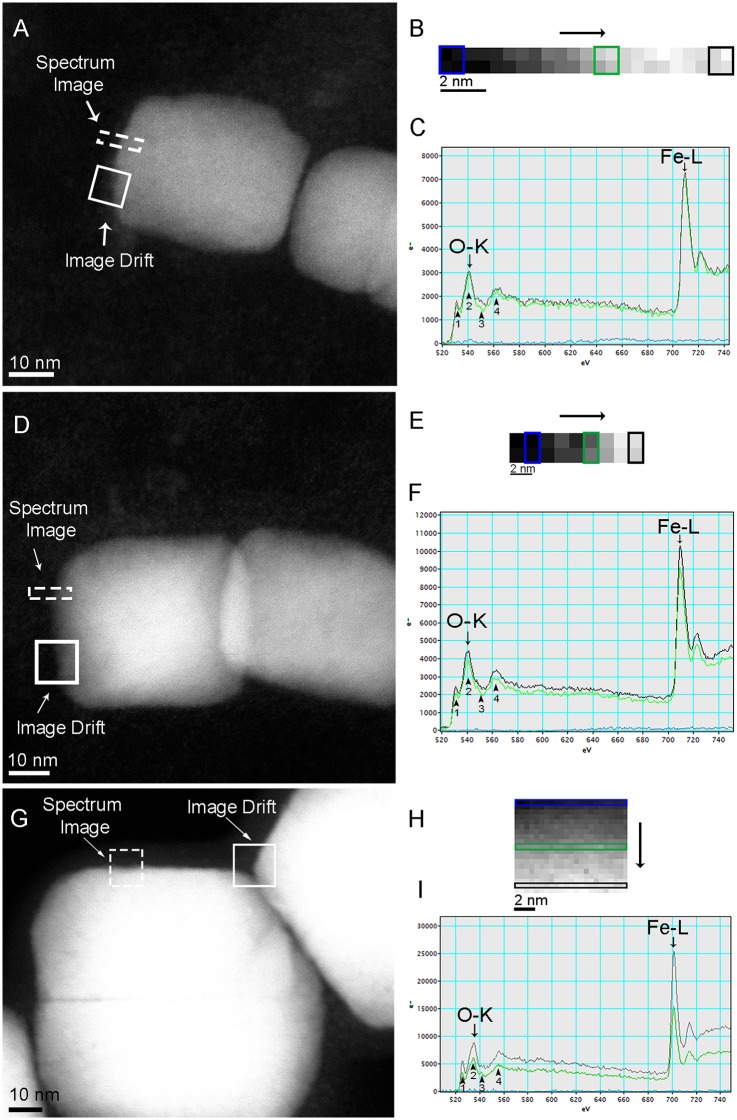
Fig 3. STEM-EELS analysis of magnetosomes’ magnetite crystals in endosome (A-C), directly within the cytoplasm of a HeLa cell (D-F), and freshly purified magnetosome (control; G-I).
A) STEM-HAADF image of magnetosomes showing the areas used for analysis (dashed rectangle) and drift correction (solid square). B) Spectrum map of the selected area in (A), showing the scanning direction (black arrow) and pixels used to obtain the EELS spectra outside (blue square), next the border (green square) and on bulk crystal (black square). C) EELS spectra outside crystal (blue line), near the crystal border (green line), and on the bulk crystal (black line) showing characteristic edges (arrows) for O (540 eV) and Fe (710 eV). D) STEM-HAADF image of magnetosome crystal within the cytoplasm showing the area selected for EELS analysis (dashed rectangle) and drift correction (solid square). E) Spectrum map of the selected area in (D), showing the scanning direction (black arrow) and pixels used to obtain the EELS spectra outside (blue rectangle), next the border (green rectangle) and on the bulk crystal (black rectangle) F) EELS spectra outside crystal (blue line), near the crystal border (green line), and on the bulk crystal (black line) showing characteristic edges (arrows) for O (540 eV) and Fe (710 eV). G) STEM-HAADF image of purified magnetosome showing the area selected for EELS analysis (dashed square) and drift correction (solid square). Faint dark straight lines inside crystals images could correspond to defects of the original nanocrystals. H) Spectrum map of the selected area in (G), showing pixels used to obtain the EELS spectra outside (blue rectangle), next the border (green rectangle) and on the bulk crystal (black rectangle). I) EELS spectra outside crystal (blue line), near the crystal border (green line), and on the bulk crystal (black line) showing characteristic edges (arrows) for O (540 eV) and Fe (710 eV). Black arrowheads in (C, F and I) show the specific of O-K edge peaks for iron oxides; in these cases similar to magnetite (see Colliex et al., 1991 [18]). Note that the bulk and the border O-K spectra are similar in all samples.

