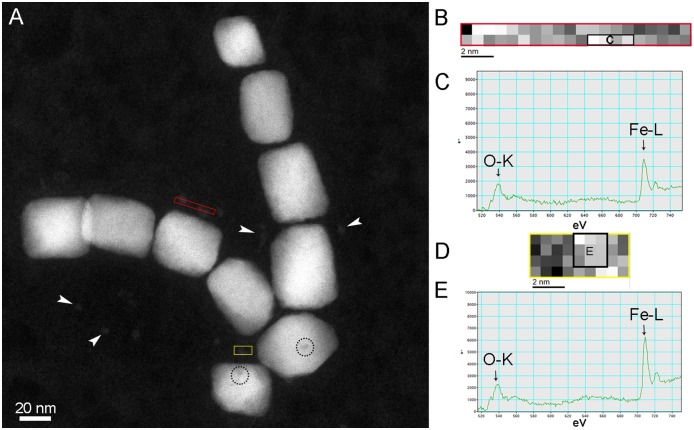
Fig 4. STEM-EELS Images and spectrum map of fine crystalline structures near magnetosome crystals.
A) STEM-HAADF image of magnetosomes in the cytoplasm of HeLa cell showing the areas selected for EELS spectrum maps (red and yellow rectangles). White arrowheads in (A) show other equivalent structures and black dashed circles indicate defects/damage in the crystal. B) Gray value spectrum map of the selected area in red rectangle (A); pixels used to obtain the EELS spectra (C) are represented in the black rectangle. C) EELS spectra of the region indicated by the black rectangle in (B) showing characteristic edges (arrows) for O (540 eV) and Fe (710 eV). D) Grey value spectrum map of the selected area in yellow rectangle (A); pixels used to obtain the EELS spectra in (E) are represented in the black rectangle. E) EELS spectra of the region indicated by the black rectangle in (D) showing characteristic edges (arrows) for O (540 eV) and Fe (710 eV). Note that the specific of O-K and Fe-L edge peaks for iron oxides, which were observed in Fig 3C, 3F and 3I, are not detected on (C) nor (E).

