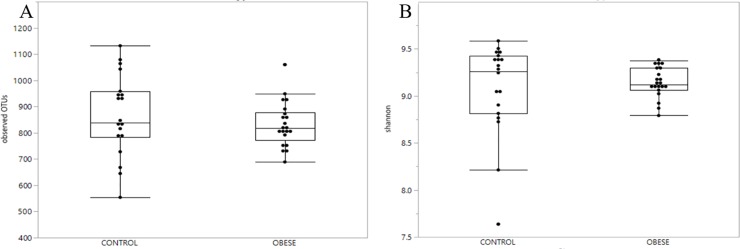
Fig 1. No differences in fecal microbiota alpha richness and diversity among groups.
A) Boxplots of observed OTUs for control (non-obese) and obese horses. The horizontal line is the median, and the top and bottom of the box extend to the 75% and 25% percentiles, respectively. The horizontal lines extending outside the box represent multiples of 1.75 times their respective interquartile range There was no statistical difference between groups (P = 0.34). B) Boxplot of Shannon diversity index for control (non-obese) and obese horses. The horizontal line within the box is the median, and the top and bottom of the box extend to the 75% and 25% percentiles, respectively. The horizontal lines extending outside the box represent multiples of 1.75 times their respective interquartile range. There was no statistical difference between groups (P = 0.62).

