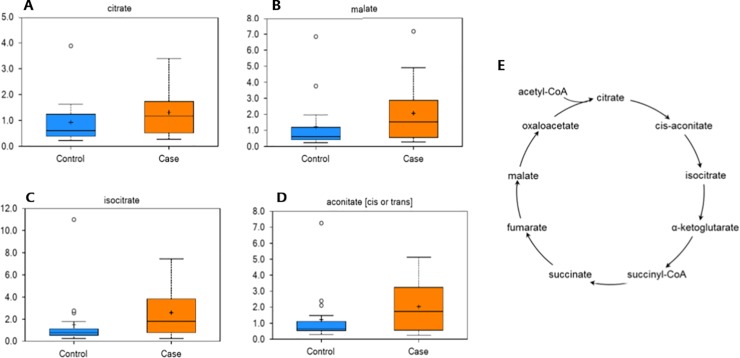
Fig 4. Intermediates of the mitochondrial tricarboxylic acid (TCA) cycle were altered in obese horses.
Box plots of the scaled intensity (y-axis) of the TCA cycle intermediates citrate (A), malate (B), isocitrate (C), and aconitate (D) comparing control (blue) and case (orange) (x-axis). The horizontal line of the boxplot is the median, and the top and bottom of the box extend to the 75% and 25% percentiles, respectively. The mean values are indicated by the plus (+) and the filled circles outside the thin horizontal line represent outliers. These TCA cycle intermediates were increased (P≤0.05) in the feces of obese horses. E) A graphical depiction of the TCA cycle is included for reference.

