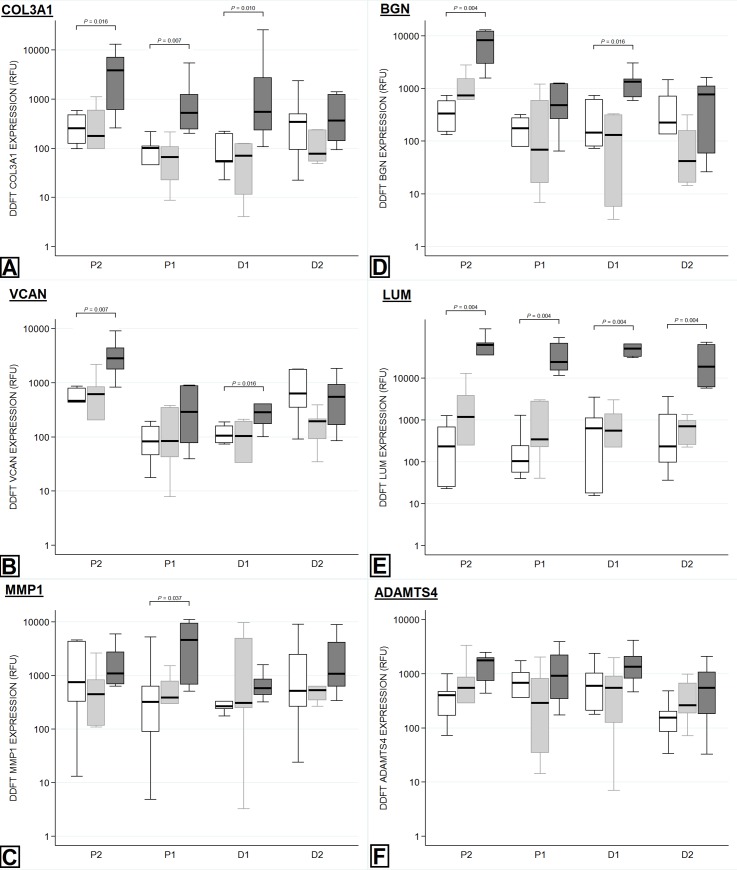
Fig 6. Regional variation in gene expression within the DDFT.
Tendons within the non-operated control (NOC) group are represented by the white box (first box), the transected extensor tendon (TxEXT) group by the light grey box (second box) and the partially transected SDFT (TxSDFT) group by the dark grey box (third box). The relative fluorescent unit (RFU) per μg of RNA is displayed on the Y-axis. The X-axis represents the regions sampled, with P2 being closest to the carpus and D2 being closest to the metacarpophalangeal joint. The level of transection in either the extensor tendons or SDFT would lie between P1 and D1. P-values for significant differences (P<0.05) between treatment groups are indicated on each graph. A: Collagen III. B: Versican. C: MMP1. D: Bigylcan. E: Lumican. F: ADAMTS4.

