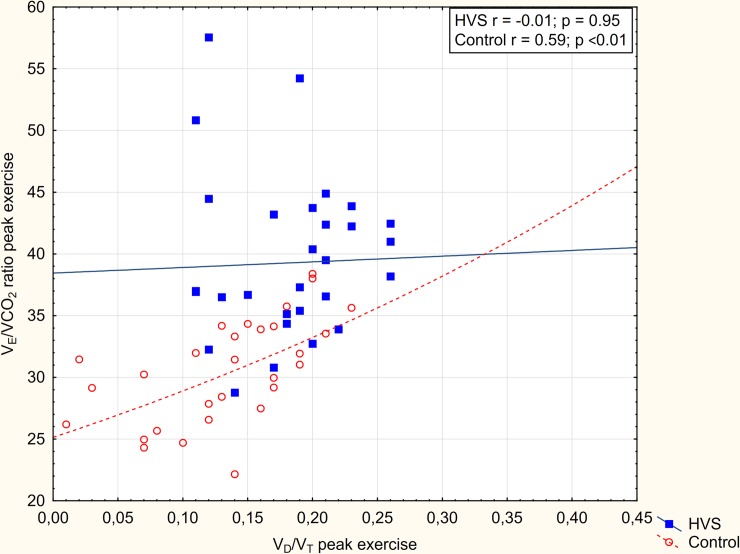
Fig 2. Relation of VE/VCO2 and VD/VT in patients with HVS and controls.
Slopes of VE/VCO2 and ratio of tidal volume to dead space (VD/VT) at peak exercise are compared in patients with HVS and controls. The shift of the slope of this relationship in patients with HVS is consistent with the observed lower PaCO2 (i.e. increased ventilatory drive).

