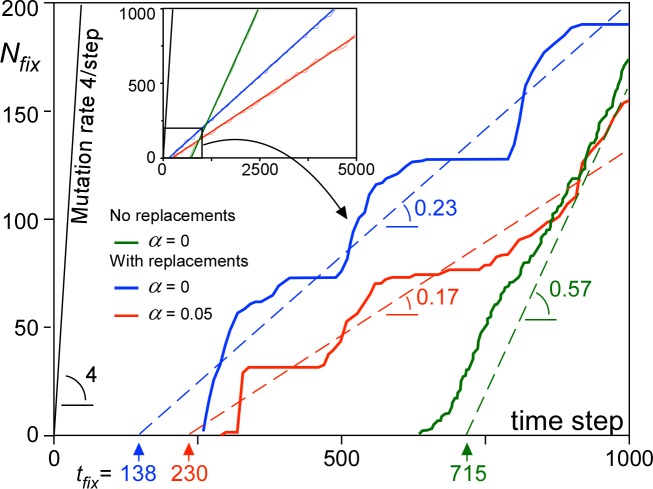
Fig 6. Number (Nfix) of mutations that reached fixation as a function of time with linear regression lines (for t>600 steps).
Main graph shows the first 1000 time steps, while the inset shows graphs for the full 5000 time steps on which the linear regressions are based. Intersection of the linear regressions is the mean time to fixation (tfix), while the slope is the rate at which mutations reach fixation. Replacement sweeps reduce the fixation chance of mutations by 60–70%, but also their tfix by 3–5 times.

