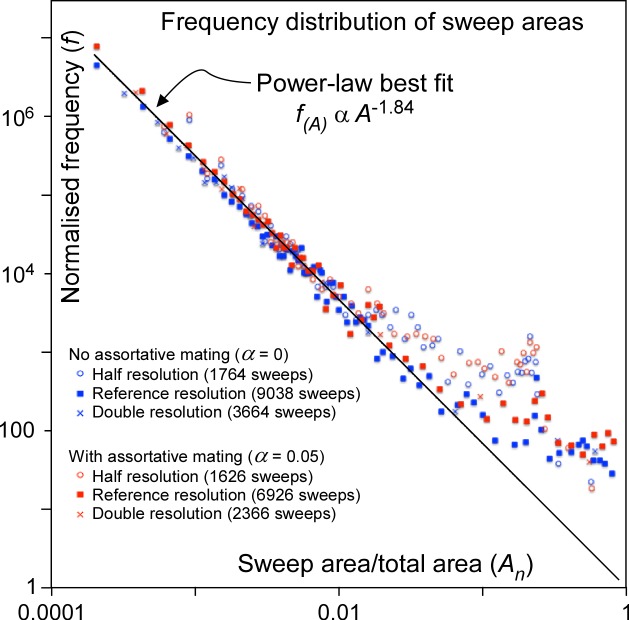
Fig 7. Normalised frequency distribution of areas swept by migration waves plotted against these areas (divided by total area) in a double-log plot.
Data follow a power-law, except for the very largest sweeps. Dots represent the simulations with the schematic 3-continent map shown in Figs 3 and 4, but with 10,000 time steps.

