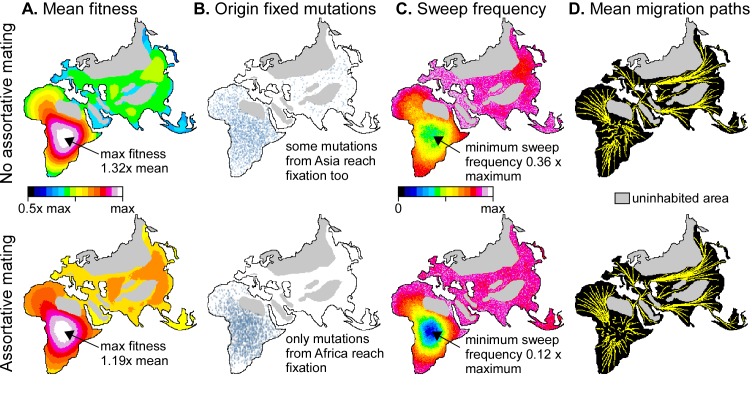
Fig 8. Example of applying the model for 10,000 steps with settings as in Figs 3A and 4A to a map of the Old World.
Top row without (α = 0) and bottom row with assortative mating (α = 0.05). A. Mean fitness of demes over the whole simulation, showing that demes in Central Africa are, on average, fitter than the minimum at the margins of the populated area. B. Origin of all mutations that reached fixation. Most (α = 0) or all (α = 0.05) these mutations originated in Africa. C. Number of times that a deme has been swept by a migration wave. Demes in Central Africa experienced significantly fewer sweeps than the rest of the world, especially in case of α = 0.05. D. Mean migration paths, all emanating from central Africa and diverging towards the periphery of the continent and into Asia.

