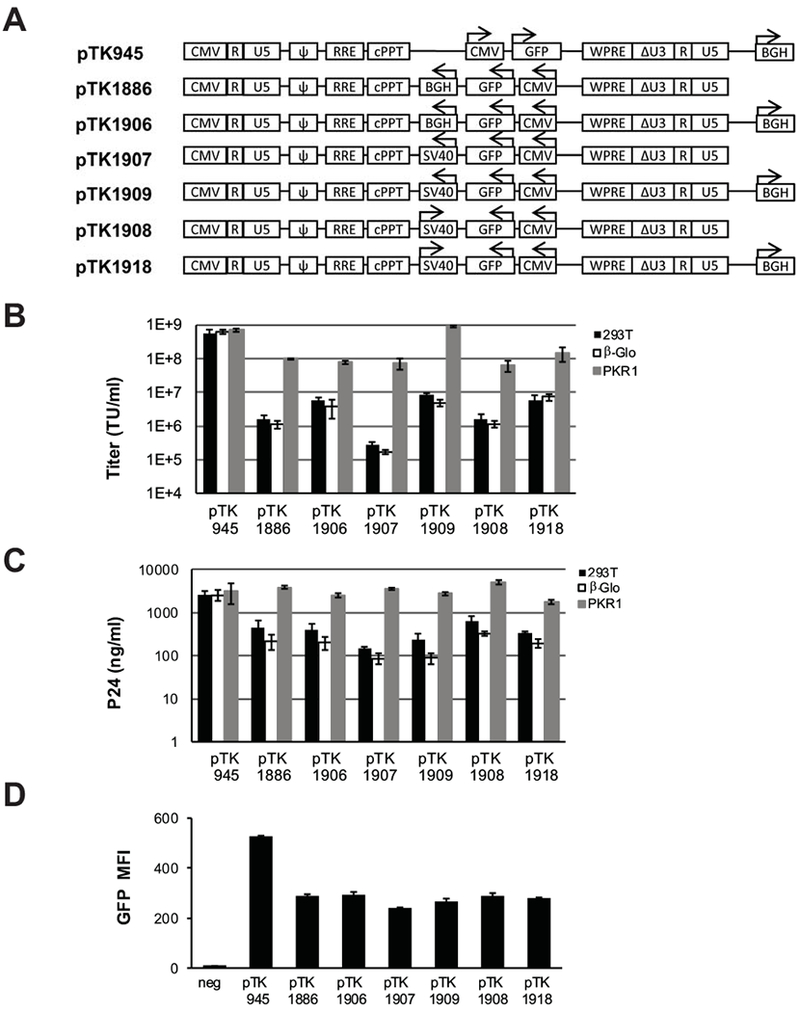
Figure 4. Improved vector design enhances vector titers.

(A) Depiction of lentiviral vectors comprising SV40 and BGH poly-A sites in various positions and orientations to the LTR’s. Arrows indicate either the direction of transcription from the internal CMV promoter or the orientation of the parental SV40 poly-A signal. BGH: bovine growth hormone poly-A signal; SV40: Simian virus 40 poly-A signal; pbi: tetracycline regulated-promoter. (B-C) Bar graphs describing vector titers and concentrations of physical vector particles. Lentiviral vectors pTK1886, pTK1906, pTK1907, pTK1908, pTK1909, and pTK1918 were generated by transient transfection in 3 different 293T-based cell lines: naïve 293T cells (black bars), β-globin knockdown cells (white bars) and PKR1 knockdown cells (grey bars). The conventional pTK945 vector served as a positive control. Vectors were generated in 3 independent experiments (n=3), and represented as average ± SD. (B) Vector titers (TU/ml) were determined at 72hr post-transduction by scoring GFP positive cells following serial dilutions on 293T cells. (C) Concentration of physical vector particles at p24gag level was measured by ELISA, and represented as average ± SD. (D) FACscan analysis of transgene (GFP) expression levels. Vector transduced 293T cells were harvested for FACscan analysis at 72 hours post-transduction. Mean fluorescence intensity (MFI) was quantified with the FlowJo software. Error bars represent the standard deviation of 3 independent measures. To minimize the effect of multi-vector transduction events on transgene expression analysis, target cells were transduced at a relatively low m.o.i (<0.1). Consequently, a percent of GFP-positive cells was lower than 17.2%. Representative flow histograms are shown in supplemental figure 2.
