
Figure 5. Optimization of transgene expression from ECOO comprising vectors.
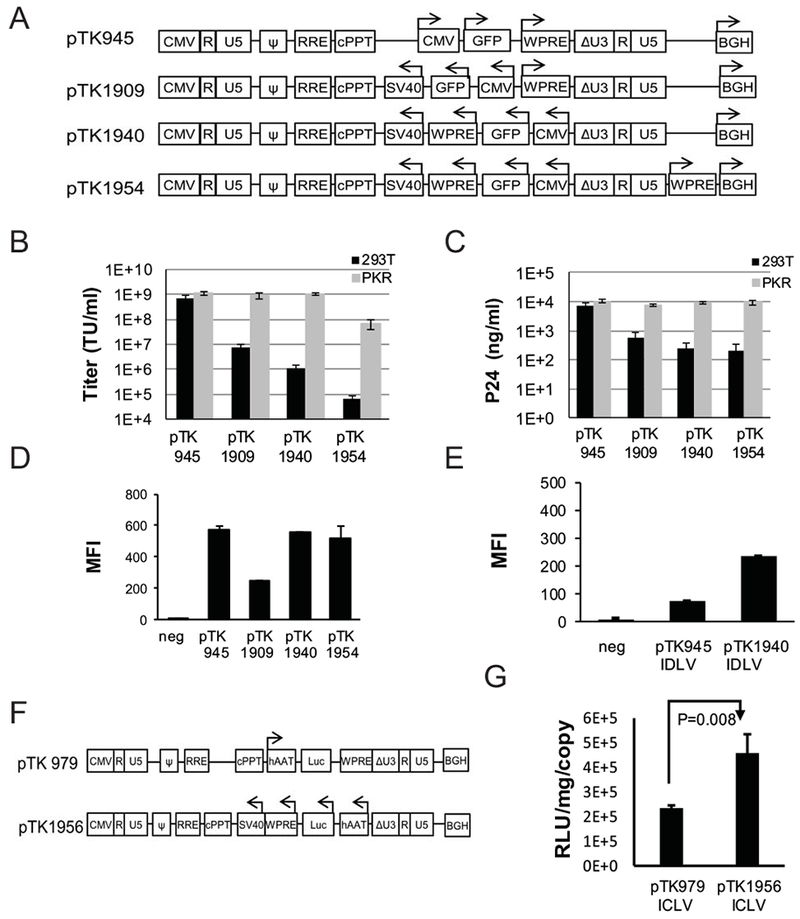
(A) Depiction of conventional and ECOO-comprising lentiviral vectors, pTK945, pTK1909, pTK1940 and pTK1954. Both vectors contain an internal WPRE (in opposite orientation to the LTR’s) between the transgene of interest (GFP) and the SV40 poly-A sequence. A second WPRE sequence in the same orientation to the LTR’s is positioned downstream to the 3’ LTR of pTK1954. Arrows indicate the direction of transcription from the internal CMV promoter or the orientation of the BGH poly-A and WPRE sequences positioned downstream to the 3’ LTR. (B-C) Bar graphs describing titers and concentrations of physical vector particles. Lentiviral vectors pTK1940 and pTK1954 were generated by transient transfection in either naïve or PKR deficient (PKR1 cells) 293T cells. The conventional vector, pTK945 and the WPRE-lacking vector pTK1909 served as positive and negative controls, respectively. (B) Transducing vector titers (TU/ml) were determined by scoring GFP-positive cells following dilutions on 293T cells. (C) Concentration of physical vector particles in conditioned media at 72h post transfection were determined by p24gag ELISA. (D) Bar graph describing FACscan analysis of GFP expression levels as MFI in 293T cells at 72hr post transduction with the ICLV’s pTK945, pTK1909, pTK1940 and pTK1954. The vectors were generated in PKR knockdown 293T cells. To minimize the effect of multi-vector transduction events on transgene expression analysis, target cells were transduced at a relatively low m.o.i (<0.1). Consequently, percentages of GFP-positive cells were lower than 19%. Representative flow histograms are shown in supplement figure 3. (E) Bar graph describing FACscan analysis of GFP expression levels as MFI in 293T cells at 72hr post transduction with the IDLV’s pTK945 and pTK1940. Naïve 293T served as a negative control. The vectors were generated in PKR knockdown 293T cells using an integrase deficient packaging cassette encoding the D64E integrase mutant. (F) Depiction of lentiviral vectors carrying firefly luciferase (Luc) expression cassettes driven by the liver specific, human alpha 1-antitrypsin (hAAT) promoter. Arrows indicate the direction of transcription from the internal hAAT promoter. (G) Bar graph describing efficiency of luciferase expression from the hAAT promoter at 72hr post transduction of HepG2 cells with conventional (pTK979) or ECOO-comprising vector pTK1956. Relative light units (RLU) were determined by luciferase assay and normalized to total protein concentration and vector copy number per cell (VCN) as determined by real time PCR. All data were represented as average ± SD of 3 independent experiments. P value (p=0.008) was determined by two tail student’s T test.