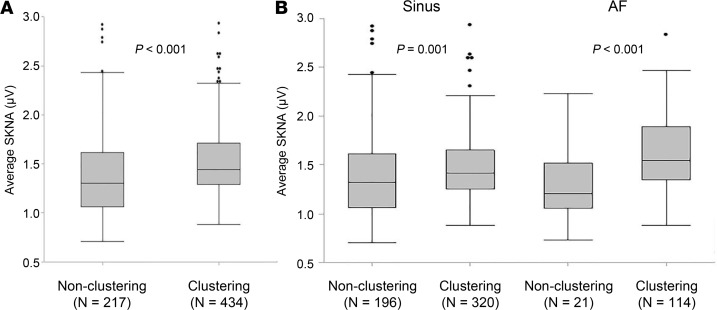
Figure 3. Distribution of SKNA burst in the patients with clustering versus nonclustering episodes.
The box-and-whisker plots indicate the distribution of peak burst amplitude of average SKNA in a 60-s window. (A) In patients with clustering episodes, SKNA bursts distributed in the higher ranges than in the patients without clustering. (B) The distribution range associated during sinus rhythm are similar in both patients, but median amplitude are higher in the patients with clustering episodes. Furthermore, the distribution of bursts associated with AF in the patients with clustering episodes was much higher than in the patients without one. All box-and-whisker plots show medians and 25th and 75th percentiles, and the whiskers show the minimum and maximum, excluding outlying values. Black dots indicate outlying values. P values shown in A and B were determined by the Mann-Whitney U test. SKNA, skin sympathetic nerve activity; AF, atrial fibrillation; IQR, interquartile range.

