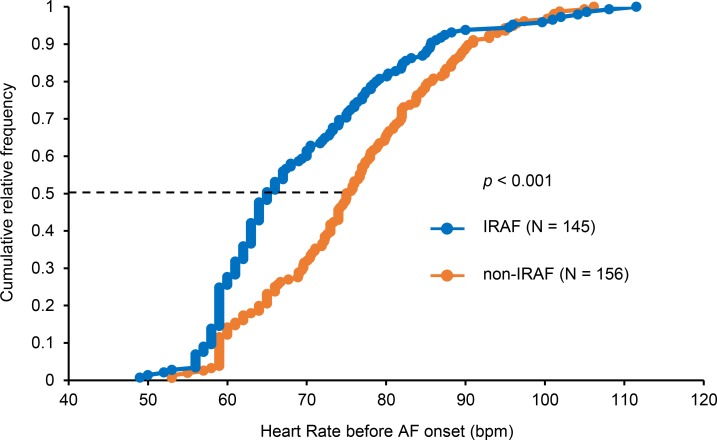
Figure 5. Cumulative relative frequency of heart rate 10 s before AF onset.
There was a significant (P < 0.001) difference between heart rate before IRAF (blue line) and that of non-IRAF (orange line). At 50% of the distribution (dotted line), heart rate before onset was 65 bpm in IRAF and 75 bpm in non-IRAF. The P value was determined by the Mann-Whitney U test based on data distribution. AF, atrial fibrillation.

