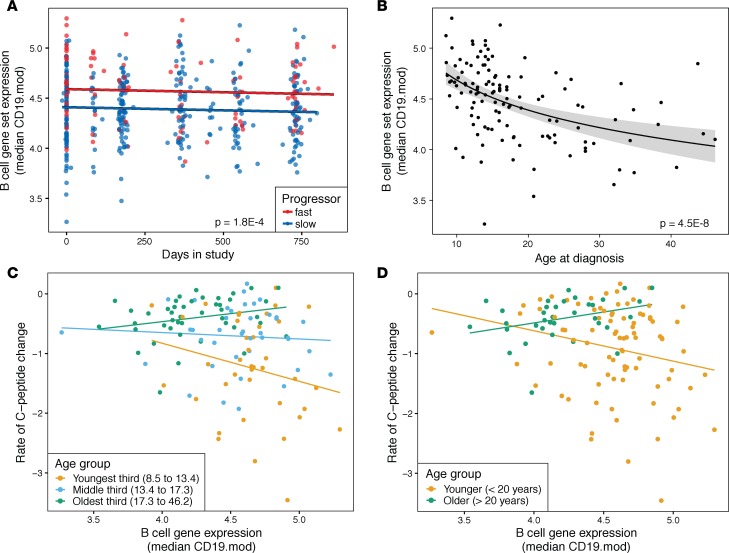
Figure 4. B cell gene expression varies with C-peptide loss in T1D subjects in an age-dependent manner.
(A) Median B cell gene expression levels (CD19.mod) over time. Points show individual patient values over the study time frame; lines show model estimates for fast and slow progressors. Expression values were batch-corrected to remove differences by trial and RNA-seq batch. Fit lines have identical slopes, as there was no evidence of an interaction between study day and progressor group; significance is for difference in intercept between groups from linear mixed-effects model. n = 470 measurements from 138 subjects. (B) Expression of B cell genes (CD19.mod) at study baseline in relation to subject age. Model fit line is based on a logarithmic function; shading shows standard error of the model. Significance values are from linear model contrasts. Gene expression values shown are for baseline visits only. n = 124 subjects. (C and D) Rate of change in C-peptide versus baseline B cell gene expression (CD19.mod), with subjects stratified by age at study entry. (C) Subjects were divided into 3 equal-sized groups by age. The slope of the relationship is more negative in the younger than the older patient group (P = 0.038 by linear model contrast). n = 39, 41, and 44 subjects in the youngest, middle, and oldest groups, respectively. (D) Subjects were divided into 2 groups using sliding-window analysis, which predicted a break at 20 years of age. The relationship is more negative in the younger than the older patient group (P = 0.032 by linear model contrast). n = 89 and 35 subjects in the younger and older groups, respectively.

