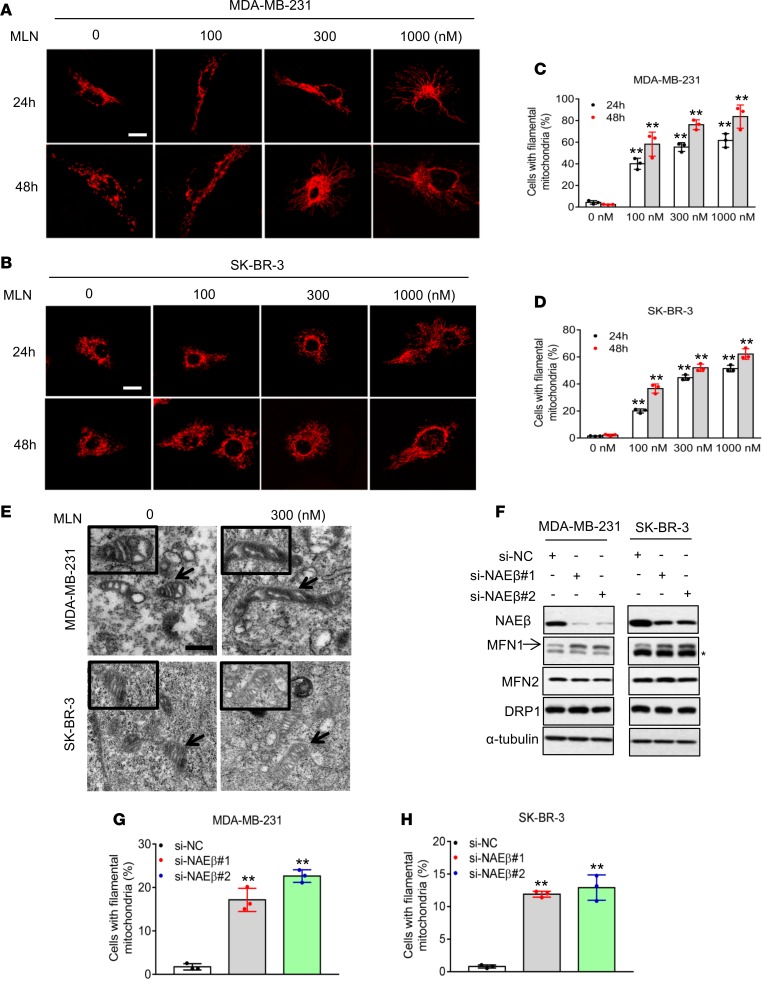
Figure 1. Inhibition of neddylation induces mitochondrial fusion.
(A and B) MDA-MB-231 and SK-BR-3 cells were transfected with Mito-DS-Red and then treated with indicated concentrations of MLN4924 for 24 and 48 hours. The images of mitochondrial morphology were obtained by confocal microscopy. Scale bars: 10 μm. (C and D) Quantification of the interconnected filamentous mitochondria shown in A and B, respectively (mean ± SD, n = 3). (E) MDA-MB-231 and SK-BR-3 cells were treated with 300 nM MLN4924 for 24 hours and fixed for electron microscopy analysis. Scale bars: 0.5 μm. (F–H) MDA-MB-231 and SK-BR-3 cells were transfected with either scrambled control siRNA (si-NC), or 2 independent siRNAs targeting NAEβ (si-NAEβ-1, si-NAEβ-2) for 48 hours. Cells were then analyzed by Western blotting (F) or stained with MitoTracker Red. The asterisk indicates nonspecific bands. Mitochondrial morphology was photographed by confocal microscopy, and the interconnected filamentous mitochondria were quantified. Results were plotted and shown as mean ± SD (n = 3) (G and H). *P < 0.05, **P < 0.01 by 1-way ANOVA.

