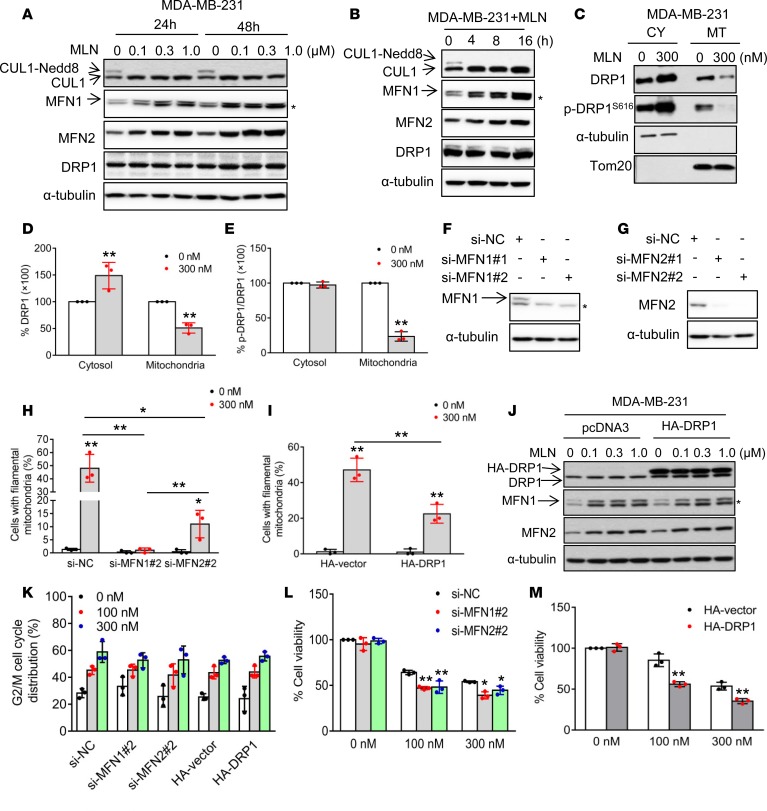
Figure 2. Mitochondrial dynamics regulators mediate MLN4924-induced mitochondrial fusion.
(A and B) MDA-MB-231 cells were treated with various concentrations of MLN4924 for 24 or 48 hours (A), or treated with 300 nM MLN4924 for indicated time periods (B) and analyzed by Western blotting using the indicated antibodies. Asterisks in all Western blots indicate nonspecific bands. (C) MDA-MB-231 cells were treated with 300 nM MLN4924 for 24 hours and mitochondria were isolated. Cytoplasmic (CY) and mitochondrial (MT) fractions were analyzed by Western blotting. α-Tubulin and Tom20 served as markers for cytoplasmic and mitochondrial fractions, respectively. SE, short exposure; LE, long exposure. (D) DRP1 expression levels in cytosol and mitochondria in C were normalized to α-tubulin and Tom20, respectively. Results are shown as mean ± SD (n = 3). (E) Phosphorylated DRP1S616 levels in C were normalized to total DRP1 levels in indicated cellular fractions (mean ± SD, n = 3). (F and G) MDA-MB-231 cells were transfected with indicated siRNAs against MFN1 or MFN2. Forty-eight hours after transfection, cells were harvested and analyzed by Western blotting. (H and I) MDA-MB-231 cells were transfected with indicated siRNAs (H) or plasmids expressing HA-vector (I) for 24 hours, and then treated with 300 nM MLN4924 for another 24 hours. Cells were then stained with MitoTracker Red, and mitochondrial morphology was photographed by confocal microscopy. The interconnected filamentous mitochondria are quantified (mean ± SD, n = 3). (J) MDA-MB-231 cells were transfected with HA-vector or HA-DRP1 for 24 hours, followed by treatment with various concentrations of MLN4924 for another 24 hours before being analyzed by Western blotting. (K) MDA-MB-231 cells were transfected with indicated siRNAs against MFN1 or MFN2 and plasmids expressing HA-vector for 24 hours, treated with 100 or 300 nM MLN4924, followed by FACS analysis after 24 hours. Cells at the G2/M phase were plotted (mean ± SD, n = 3). (L) MDA-MB-231 cells were transfected with si-NC, si-MFN1-2, or si-MFN2-2 for 24 hours, then treated with 100 or 300 nM MLN4924, followed by trypan blue exclusion assay for cell viability after 48 hours (mean ± SD, n = 3). (M) MDA-MB-231 cells were transfected with HA-vector and HA-DRP1 for 24 hours, then treated with 100 or 300 nM MLN4924, followed by trypan blue exclusion assay for cell viability after 48 hours (mean ± SD, n = 3). *P < 0.05, **P < 0.01 by 1-way ANOVA.

