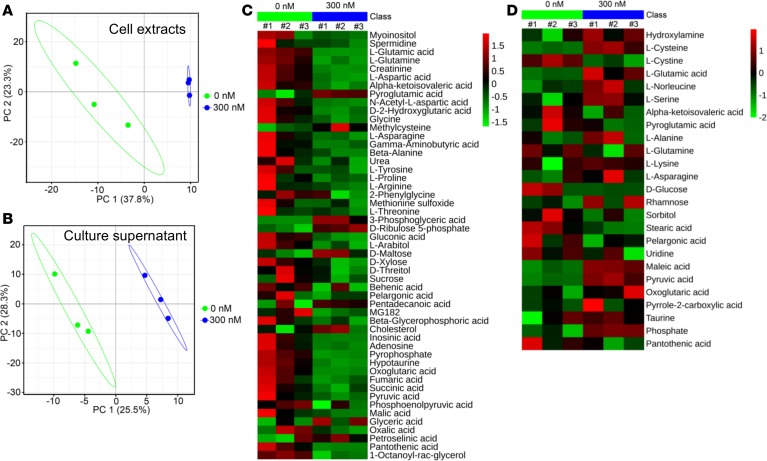
Figure 4. Mass-spectrometry-based metabolic profiling.
(A and B) MDA-MB-231 cells were treated with DMSO or 300 nM MLN4924 for 24 hours, and cell extracts (A) and culture supernatants (B) were subjected to untargeted metabolic profiling analysis. Shown is the PLS-DA score plot from 3 independent preparations of cell extracts/supernatants. (C and D) Metabolites in A and B with VIP (variable importance in the projection) value greater than 1 are displayed in a heatmap format. Colors represent the levels of the metabolites from low (green) to high (red).

